Er… are you asking generally, or regarding a certain piece of software?
If the latter, it must be dead easy to check?
Or have I misunderstood something?
I’m on my phone, can’t write a complete answer, but exposure is a multiplication, so the zeros won’t move…
In general, I’d surmise that all of the operators in your list have an arithmetic multiplication as their foundation, so that dynamic is in play. However, under the hood things are never that simple. In gimp, make an artificial image of red, lighten it up, see what comes out…
For example, using ImageMagick’s HSL colorspace, (128,0,0) is at maximum saturation, 100%. But saturation can be increased by increasing red while decreasing green and blue. Yes, this gives negative G and B values.
The problem is not the problem. The problem is what you mean by ANY value you’ve mention or operation you mention.
First - what does 128 mean at all? and why 128? Do you mean integer encoding between 0 and 256? So… 0.5? and what 0.5 means?
the operations you’ve mention are just math. what actual representations are decoded/operated on/encoded… that’s a different matter and it depends.
I know it’s easy to skip to software but I really find trying to understand things from ground up helps in general.
My recommendation: start from https://hg2dc.com/ (question 1) and work your way up. And for processing - Aurelien’s videos apply usually to all processing
Actually, values are less important than what you mean by the terms. Each term can have any number of interpretations. You mentioned that you are using GIMP. You would have to tell us what your document settings are and which tools you are using. That way someone could look into the code and tell you exactly what is going on.
PS I will add the GIMP tag to your OP for clarification.
I was really just interested in how a pixel’s values change when these tools are applied, not really the theory. Just what does it do to a pixel to add saturation, and so on.
Tools Used: Colors/
Exposure
Color Temperature
Saturation
Brightness-Contrast
Hue-Chroma
The ordering is by similarity of effect, e.g., both exposure and color temperature only change R regardless of whether you increase or decrease the effect from the starting point. Edit: that’s only true when g and b are 0. How each tool calculates the changes is a complicated affair involving equations that give me nightmares.
Tool: Colors/
R orig 128
G orig 0
B orig 0
Exposure
Exposure +
245
0
0
Exposure
Exposure -
97
0
0
Color Temperature
Color Temperature +
132
0
0
Color Temperature
Color Temperature -
109
0
0
Saturation
Saturation +
140
0
0
Saturation
Saturation -
108
38
38
Brightness-Contrast
Contrast +
128
0
0
Brightness-Contrast
Contrast -
128
65
65
Hue-Chroma
Chroma +
160
0
0
Hue-Chroma
Chroma -
95
48
38
Brightness-Contrast
Brighten +
139
22
22
Brightness-Contrast
Brighten -
105
0
0
Hue-Chroma
Lighten +
185
65
44
Hue-Chroma
Lighten -
62
0
0
R orig 128
G orig 40
B orig 50
Exposure
Exposure +
245
84
103
Exposure
Exposure -
69
18
23
Color Temperature
Color Temperature +
131
40
47
Color Temperature
Color Temperature -
118
41
60
Saturation
Saturation +
137
28
43
Saturation
Saturation -
115
52
57
Brightness-Contrast
Contrast +
128
2
16
Brightness-Contrast
Contrast -
128
67
74
Hue-Chroma
Chroma +
161
0
36
Hue-Chroma
Chroma -
93
65
65
Brightness-Contrast
Brighten +
147
63
81
Brightness-Contrast
Brighten -
103
32
40
Hue-Chroma
Lighten +
199
103
108
Hue-Chroma
Lighten -
67
0
0
Contrast is interesting to me because it doesn’t change the original R value, just G and B.
Your choice of input actually set that up. ‘Contrast’ is about the rate at which tone changes, which can be considered with a graph of a line with a certain slope. Steeper the slope, higher the contrast, and vice versa. A simple contrast tool’s graph will ‘pivot’ about the center as contrast is changed, so a value of 128 on a 0-255 scale will sit on that pivot, and not change as the slope is changed.
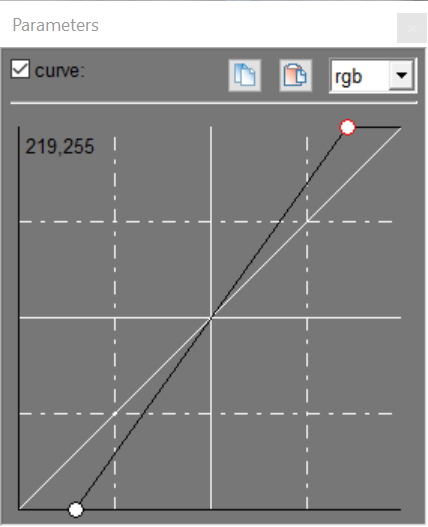
You can demonstrate such with a tone curve. To increase contrast with a curve, take the lower-left control point and drag it right, and then drag the upper-right point left by an equal amount. Should look like this:
Note the midpoint of the line still intersects the center of the graph. X=128, Y=128. Now, a decrease in contrast looks like this:
Still, the midpoint of the line intersects the graph center. X=128, Y=128…
I would add that “contrast” is usually a measure of comparison between pixels. Changing the contrast of a single pixel has no meaning. If we have a mid-gray pixel surrounded by black pixels then increasing the contrast of the image will lighten the gray. But a mid-gray pixel surrounded by white pixels then increasing the contrast of the image will darken the gray.
But a “contrast”-increasing control might do something different, and simply lighten all values above some middle, and darken all values below that middle.