Extract band from multiband/multispectral BSQ image

I have an image from NASA PDS archive, named 2n289977682xylb0eop1965l0m1, with .IMG extension. It’s a multiband image in BSQ format; the file starts with a label (which is also downloaded separately as .LBL file); the important part of the label is this one:

/* IMAGE DATA ELEMENTS */

OBJECT = IMAGE
INTERCHANGE_FORMAT = BINARY
LINES = 1024
LINE_SAMPLES = 1024
SAMPLE_TYPE = IEEE_REAL
SAMPLE_BITS = 32
BANDS = 3
BAND_STORAGE_TYPE = BAND_SEQUENTIAL
CHECKSUM = 1.57131e+09
FIRST_LINE = 1
FIRST_LINE_SAMPLE = 1
MAXIMUM = 4016.0
MEAN = 1498.52
MEDIAN = 1450.0
MINIMUM = 0.0
SAMPLE_BIT_MASK = 2#0000111111111111#
STANDARD_DEVIATION = 296.218
INVALID_CONSTANT = (0.0,0.0,0.0)
MISSING_CONSTANT = (0.0,0.0,0.0)
END_OBJECT

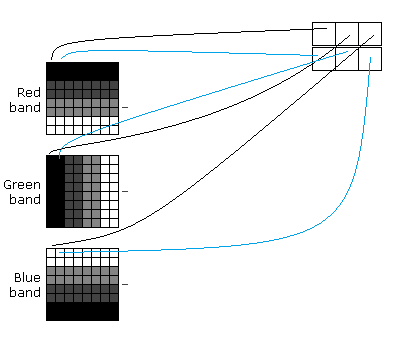
It’s a “Band SeQuential” image (BSQ); its size is 1024x1024. The file contains 3 different “bands”, which represent X, Y and Z coordinates of a 3d object.
A direct conversion to “something visible” results in this:

image

Instead, what I need to get is a greyscale image where each pixel has a gray value representing the Z value of the model, which is known as “depth map”:

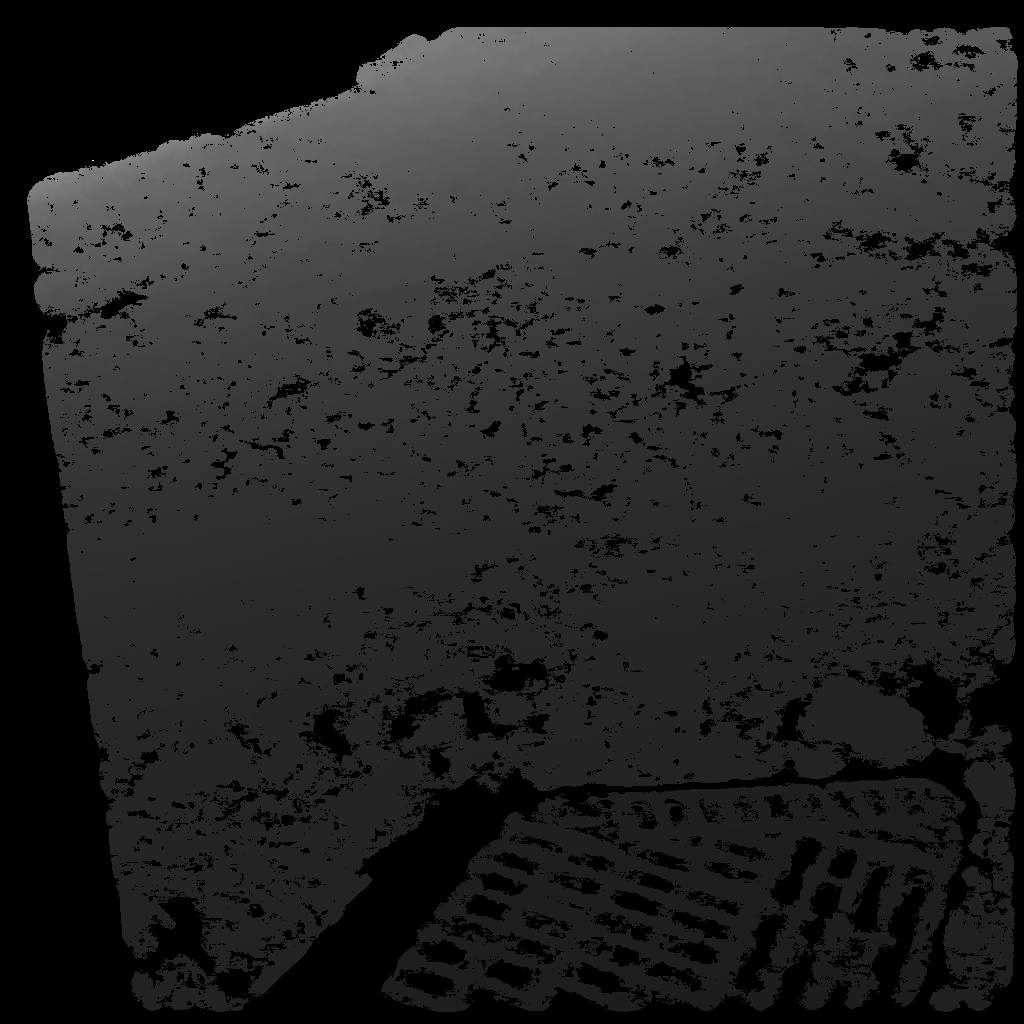
By loading a depth map together with a companion image in this page, you get a 3d model.

BSQ format

I think the above RGB image has been obtained by merging the 3 bands; Instead I need to extract the 3 bands in 3 separated images.

An alternative useful output would be a text file in XYZ format, where each line contains just 3 values separated by space: each line contains values from the 3 bands, in this way:

image

Can G’MIC be used for these tasks? I am on Windows 10.

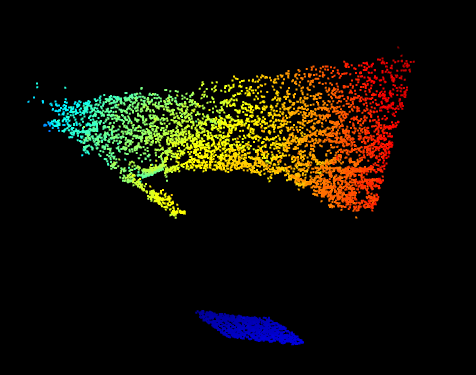
I found a strange page which converts online IMG file into text; it’s quite slow in converting 1 million bytes into several millions characters, but after some experiments I ended up converting a part of the image, which gives an idea of how the 3d model should look: it’s very elongated going away from the observer, and very low; ideally it would fit in a 100 x 10 x 1000 box.

You can view my resulting 3d file into this online point cloud viewer (select format “XYZ”; use CTRL+mouse to rotate around vertical axis, SHIFT+mouse for other axes):

image

@jumpjack Welcome to the forum!

Let’s see what @David_Tschumperle has to say…

At Extracting one band from a multiband BSQ file? · Discussion #5186 · ImageMagick/ImageMagick · GitHub , I have shown how ImageMagick can read the input file and make, for example, a 3-channel TIFF file:

magick -size 1024x1024+45056 -define quantum:format=floating-point -depth 32 -endian MSB gray:2n289977682xylb0eop1965l0m1.img -combine -evaluate Divide %[fx:QuantumRange] xyl.tiff

xyl.tiff contains values between -5.05e-05 and 0.000808, on a nominal scale of 0 to 1.

I suspect G’MIC could be used to make an interactive display of point cloud data, but (a) I don’t know G’MIC sufficiently well and (b) I don’t know if the data needs further transformation.

(EDIT: changed filename from eff.tiff ro xyl.tiff.)

(EDIT2: changed “-5.05e05” to “-5.05e-05”.)

That is why I pinged David. In the meantime, if you haven’t already done so, please refer to:

There is also reference content in the tutorials and the G’MIC files themselves.

I’m not certain how to import MSB format binary in g’mic, I had to do that in a couple steps (first basically converts to LSB file but mirrored):
gmic -i raw:2n289977682xylb0eop1965l0m1.img,uint8 mirror y -o raw:mytest,uint8
gmic raw:mytest,float32,1024,1024 mirror xy

I have no doubt there’s a better way to do that, I just don’t have the knowledge. Once it’s in g’mic, there are lots of ways to visualize it. I may come back later with more info if David does not.

In G’MIC:

$ gmic raw:2n289977682xylb0eop1965l0m1.img,float32,1024,1024,1,3,45056 endian

I don’t really know what these points represent, so I cannot tell yet how to visualize them in 3D, but once the data has been read, it is always possible to do something with it :slight_smile:

1 Like