This thread was so full of great ideas it inspired me to use grain in this week’s video. Thanks Pat David for bringing these great minds together.
2 Likes
@harry_durgin I’m happy that this discussion has inspired you, even in a small way. Keep up your nice work!
2 Likes
Watched the video @harry_durgin, always a pleasure to watch the thought process behind the image processing.
2 Likes
Sorry for resurrecting the thread, tonight I needed some fun. 
I wanted to compare the power spectrum of the darktable grain with some real scan samples.
We have already discussed about film grain distribution as a function of exposure, it remained to be assessed the spatial distribution of the grain.
Do you guys have high resolution film grain scans to share?
For now, I only found a couple of Kodak scan samples at this page: http://www.redwingdigital.com/bully-pulpit/film_grain/. To be honest they look too perfect to be real scan.
For the comparison I took a 24 MP 50% gray image and I applied several ISO levels of grain with darktable.
Then I calculated the power spectrum of the grainy images assuming a dimension of 24x36 millimiters of the frames.
darktable, 100% strength, 24MP

Kodak scan samples, 16MP

Here is a quick comparison of the 1600 ISOs.

To me, the power spectrum of the Kodak samples look like more Gaussian-shaped and a little more uniform.
Here are two portion of the images.
trix 1600

darktable 1600

If I understood well i could try to tweak the octaves amplitudes of the simplex-noise in order to balance the power spectrum shape.
4 Likes
I keep you updated because I know you’re dying to see more frivolous grain stuff. 
After a deeper search I found other two film scan samples (of lower quality) for the grain comparison.
Here all the sources:
agfa apx 400 8 MP
kodak tmax 400 6 MP
kodak trix 1600 16 MP
kodak tmax 3200 16 MP
In order to better compare the shape of the power spectrum functions I normalized the spatial frequency by the standard deviation. The power spectra are also normalized by the area.

All the real samples are essentially superimposed while darktable grain is a bit off and more Lorentzian-shaped.

128x128 portion of the images upscaled to 24 MP in order to match the darktable output. The first two are strongly affected by jpg compression artifacts.
Now the comparison is slightly more satisfactory than the one of the previous post because the grain samples are coming independently from three sources. I feel more confident about what to look for when hacking the noise generation algorithm.
I am also happy to see that there is some kind of confirmation of the feeling about darktable grain being a little less “organic” than the real one, and I’m not imagining things  .
.
1 Like
IIRC @patdavid has some grain scans he uses to add grain to his images. Maybe he can share his file, too?
Absolutely! This is a T-Max 400 frame (http://farm8.staticflickr.com/7228/7314861896_292120872b_o.png):

2 Likes
Lovely composition, and the bokeh is superb! I guess that’s why the pros still shoot film. 
11 Likes
Few years ago I developed some code to simulate film grain, using an approach that is probably similar (but independent) to the one pointed out by Francisco @cribari: given a source image, the code generates a “grainy” version by literally adding one grain at a time, such that the average grayscale value is preserved locally.
I have not worked on this project since quite a while, and unfortunately the code is not yet in a shape that allows to make it public, but I might revise it is there is some interest (although it is REALLY slow on large images).
Nevertheless, I would really be curious to see how it compares with the other samples and methods that have been discussed above. So I put here some samples cropped from initial 6000x4000px images uniformly filles with solid gray:
50% gray, large grains:

50% gray, medium grains:

50% gray, small grains:

10% gray, large grains:

90% gray, large grains:

I can provide the hi-res un-compresses TIFF files if needed…
1 Like
Nice @Carmelo_DrRaw, thank you for your contribution!
I agree that the idea of simulating the photographic process grain by grain is really charming. 
So, let’s see some new comparisons. I plotted the normalized power spectra of:
- kodak trix 1600 (example of the scanned film grain I found so far);
- darktable grain at 1600 iso;
- @patdavid’s tmax 400 sample;
- @Carmelo_DrRaw’s 50% gray medium sample.

The grain from @patdavid is quite different from the others, it has much more high frequency content and a bump in the middle, there is a strong bias for a certain grain size. I didn’t normalize it in the same way of the others because the power spectrum doesn’t look decayed at the boundaries of the frequency axis.
The grain from @Carmelo_DrRaw resemble a lot the kodak trix 1600, it is probably slightly more peaked.
Then, I played with the octaves of the darktable simplex noise algorithm. I fitted the kodak trix 1600 power spectum using three octaves: the parameters to be determined were three frequencies and three amplitudes. I think the power spectrum “darktable 1600 proposed” came up quite close at the desired one.
It is possible to easily match other smooth monotonically decreasing power spectrum shapes.


(left) darktable 1600 - (right) darktable 1600 proposed
The difference is small, hopefully It can be appreciated that the grain on the right is more smooth and plumpy while the grain on the left is somewhat sandier.
For @Carmelo_DrRaw, here are the power spectra of the other images you provided. It looks like there isn’t a big change in size for small, medium and large samples. There is a strong change of the amplitude though.
Here are the power spectra of the 50% gray images.

Here are the power spectra of the 50% gray images normalized by the maximum.

The images with different solid gray colors have the same grain power spectrum shape but different amplitudes.
Here are the power spectra of the 10%, 50%, 90% gray images.

Here are the power spectra of the 10%, 50%, 90% gray images normalized by the maximum.

4 Likes
First of all, thanks for your very detailed study!
I think that this is not very surprising, as they result from the same grains laid out at a different spatial density.
One thing that I would find interesting is to see how other methods compare when applied to 10% and 90% gray images… I think that 50% gray is some sort of “special case” which is relatively simple to render with noise generators. Dark and light areas are instead trickier, because they are in reality generated by either very sparse or highly-dense grain distributions.
Sometimes I think about hooking up grain simulation to Filmulator’s active-crystal concentration and crystal radius simulation results… it would need a big pipeline change though.
1 Like
I like the proposed darktable noise. How does it compare to the current implementation at other “ISO” levels?
To spot some differences one could look at the lightness histograms of the grain for 10%, 50% and 90% gray.

The darktable grain at 100% intensity has the following histograms.
The 10% and 90% histograms look a lot narrower. I wonder if it would be nice to tweak them so that they match your grain @Carmelo_DrRaw, which is more sophisticated.
It performs essentially in the same way since it is only a tweak of the weights and frequencies of the noise octaves.
Here are the power spectra trends.

For direct comparison here is the old implementation.

2 Likes
@Carmelo_DrRaw, can I ask you a favor?
Could you apply the film grain of your implementation to this image:
I’m interested to see the full lightness profile of the grain.
Here is my result:
I can provide you results with other grain densities if needed…
1 Like
First of all, I think your work is very impressive, thank you for sharing it! Can I ask you a question? When you say:
“The light filtering trough the photographic film will be affected uniformly and we need to add the noise to the logarithm of the exposure.”
Why do you add the noise to the logarithm of exposure and not to the density of the film? I’m just wondering, maybe I don’t completely understand how the process works, because if the grain is in the film it should be added to the film, isn’t it?
And also, when you say uniformly you mean the noise follows a normal gaussian distribution?
Thank you in advanced!
Experimenting a bit with grain and thinking “well that’s an area where Lightroom still has an edge” (but honestly, I haven’t double checked and my memories may be a bit hazy; I should’ve made a comparison but tonight I’m lazy).
Then I’ve found this thread and wow this truly deserves an article of some sort and to be put on the front page of the NYT or something.
Anyway, I’ve understood perhaps 1% of all the math above, but what I did understand is the meaning of the midtone bias slider in the grain module. I think the effect is really good and realistic:
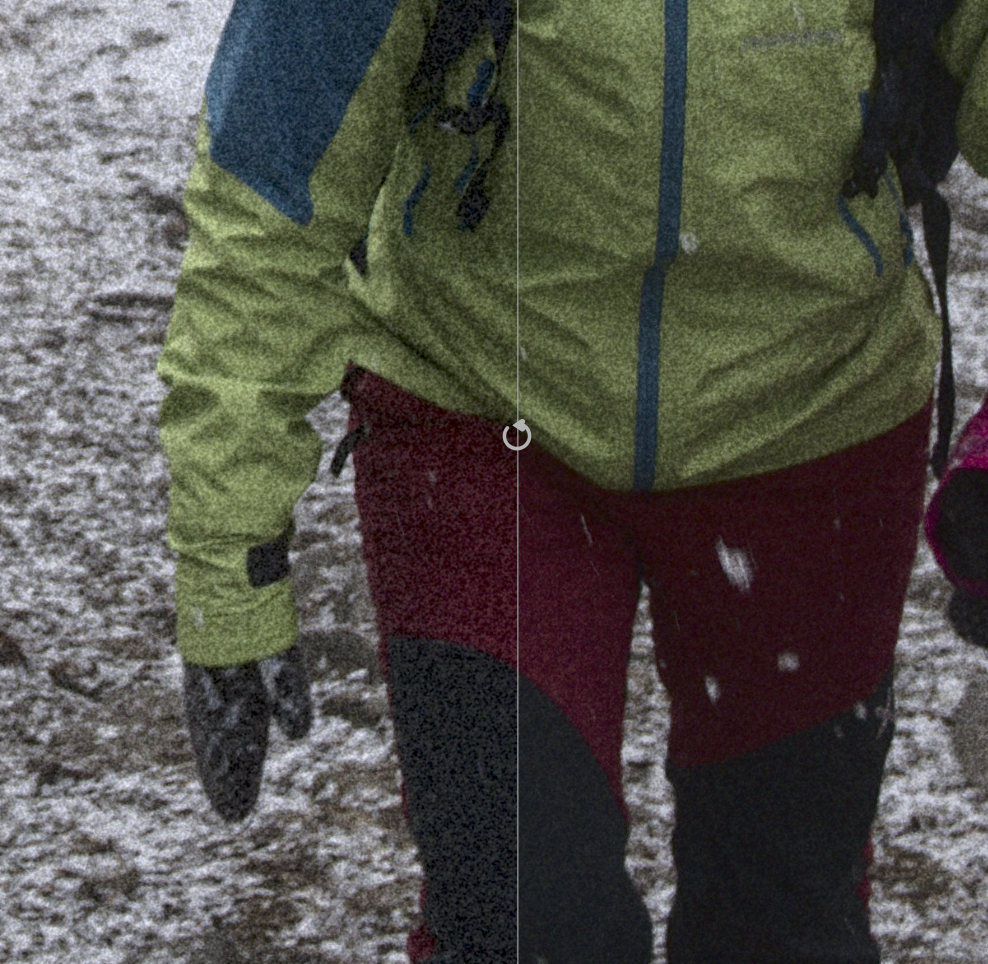
right: grain 1600ISO/strength 50% / midtone bias 100%, left with midtone bias 0%
Apart from the blog post or article mentioned above, I also think that the online manual should be updated because as of now, it does not mention what is the midtone bias slider.
3 Likes