Just out of curiosity is it possible that under some conditions raw and output histograms look similar, I mean like no demosaicing, no input profile, gamma=1, … or is it just impossible? I am having some trouble understanding how they work. Thanks!
Possible, maybe. Useful, maybe not. Why would you be interested in such a thing?
Why? Because I cannot really live in a useful world  Seriously, I think it is a way to understand digital photography, I have no particular needs. I made some tests but I never managed to get similar histograms, so I thought I were missing something.
The following gets you reasonably close. The trickiest thing is rebuilding the inverse gamma curve.
amsterdam.pef (12.4 MB)
amsterdam.pef.pp3 (11.7 KB)
1 Like
Reasonably close?
To posit an answer to your first question, if the scene has relatively low dynamic range, and you expose to the right, I think that’s the closest you can come to the “raw” histogram approximating what you might put out for display/print/whatever.
Now, to address “understanding how they work”, you need to keep in mind that a histogram is just a statistical characterization of some data set. Our “data” is an array of measured light intensities that we want to transform into a depiction of a scene. So, whether a histogram is “raw” or “output” is just an identification of when the statistics are calculated in the life of that data as we transform it from the light measurements to something that looks pretty on the display.
You probably already recognize that what the camera captures requires some work before it looks presentable. Black point compensation, white balance, demosaic, and colorspace conversion are the essential transforms, and at each stage the image histogram also changes. Stack on that list other things like your favorite tone curve, sharpening, etc., and the histogram of what goes into the JPEG is very different from what you started with in the “raw” light measurements.
I personally think that the term “raw histogram” is only useful when associated with the captured light intensities, as that is the place where consideration of its “spread” is useful for determining a good exposure. Anything after that is “intermediate”, steps on the way to “output”.
FWIW…
It seems you haven’t downloaded the pp3 file:
Oops sorry, I downloaded it from the email and it was not the same file I think… now it is ok ![]()
Anyway I was trying to get with output gamma=1 (in the color tab) what you got with an inverse tone curve (in the exposure tab). Results are exactly the same but my problem was the use of two different profiles: prophoto (working profile) and sRGB (output profile). Looking at your settings I realized they should have been the same (no matter which profile, but they have to be the same).
Thank you very much!
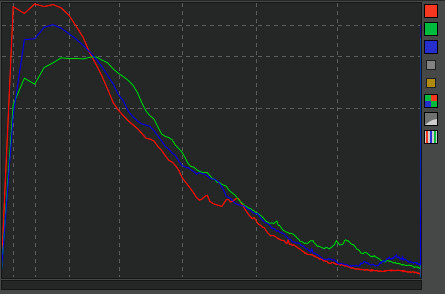
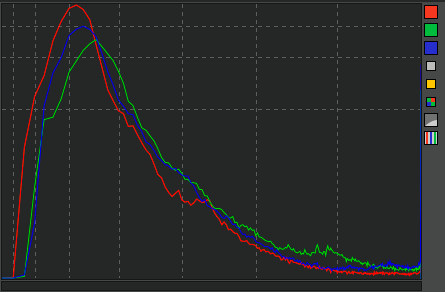
They are quite the same, it looks like the raw has some clipped shadows though, while the output has not.
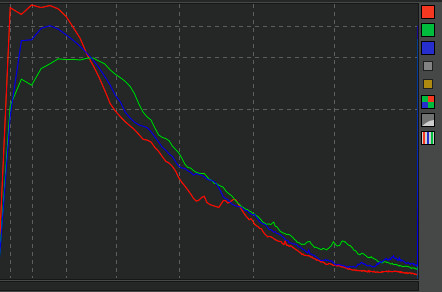
![]()
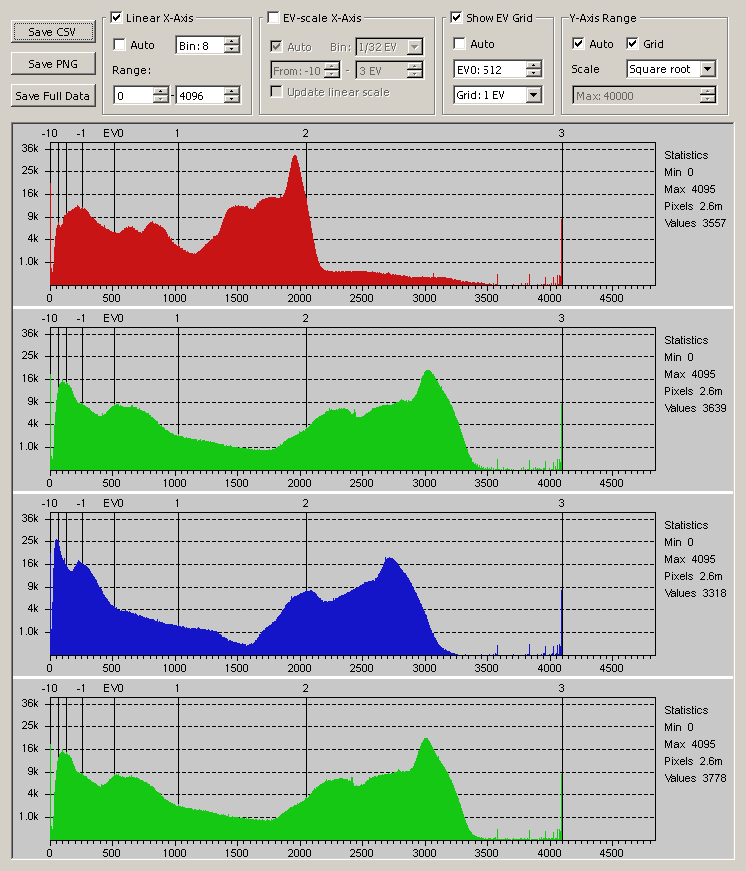
It seems that the raw histogram in RawTherapee is after demosaicing.
No, it’s before
1 Like
Shouldn’t have been more greens then, or maybe only grays?
No, the fact that bayer sensor has 2 x green (compared to red/blue) and that xtrans sensor has 2.5 x green (compared to red/blue) is taken into account already
Good to know that the raw histogram refers to the pre-demosaicing status and nonetheless it shows R-G-B channels. At least for me this makes the raw histogram confusing at best, and to make things even worse I think there is a problem with the horizontal scale (exposure stop) which is related only to the output rgb.
Please elaborate more.
Why shouldn’t it show RGB? The cfa has filters for R, G and B. Why should we only show grey in the histogram?
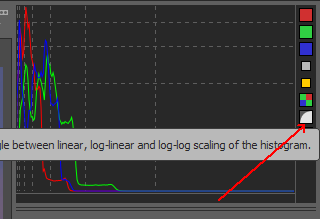
The horizontal axis of the raw histogram is perfectly linear regarding raw values if you use the linear or log-linear mode
I don’t know… maybe I’m only trying to get a RawDigger for free 
2 Likes
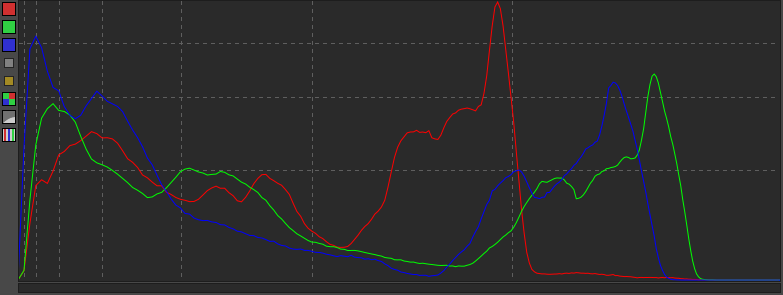
No they are not the same if you use a linear EV scale on the x-axis and you position the EV0 mark correctly. But of course it all depends on what kind of information you need/want to extract from a raw file.
RawTherapee is almost there, and this is a great thing really.
Ah, I’d be interested in hearing (reading?) your expectations. To me, bear-of-little-brain, a histogram is pretty simple if you know the nature of the data from which it’s produced; the linear/linear-log/log-log/linear-whatever/whatever scaling is just depiction shenanigans. So, understanding what others’ expect “schools” me.
I’m also considering taking on a histogram programming challenge I received from @Elle Stone some months ago. That was directed toward a stand-alone freeware program that has since stagnated, but I’m still just noodling with the idea and where it manifests itself.