Is there a way to visualize the frequency separation for modules that use wavelets (e.g. the contrast equalizer), and if not, would this be a good feature to add? See below for examples of the kind of visualization that would be helpful. Perhaps it could be a greyscale or false colour mask that can be activated while adjusting nodes, giving you real-time feedback on what details you are operating on.
I know the retouch module allows this, but I think it would be really useful to see this information for other modules like the contrast equalizer, denoise profiled, etc., and anything else that operates in the wavelet domain. I feel it would remove a lot of the trial and error in using these modules.
My workaround for the time being is to use the retouch module to get a sense of where certain details are, but I don’t know how many scales to create to mimic the frequency bands that the contrast equalizer works on. Any tips for this? There are 6 nodes in the contrast equalizer, does this simply equate to 6 scales in the retouch module or are their algos completely different?
It’s a really challenging task to achieve properly, first because of the memory copies between GPU and GUI that will need thread locks and degrade performance by a lot, then because contrast needs to be dynamically adjusted for each scale to produce a legible output (the contrast adjustments in retouch don’t work great all the time, and the whole thing is absurdly slow).
Ok, that’s a shame. And after watching your videos, I know how you like to see masks of what you’re working on
Would it be more feasible to ignore the real-time aspect of it per module, but include something in the main window (where the exposure indicators are) which at least displays e.g. 6 scales of frequency separation that correspond with the nodes of the contrast equaliser. So, basically what the retouch module can do, but limited to 6 scales, and is persistent so can be seen regardless of which module you’re working on? Maybe this would be too much of a hack and ugly, but just throwing ideas out there…
I tried applying the difference blend mode while using the contrast equalizer and found it’ll pick up on mid frequencies, but its not sensitive enough to capture differences in higher levels. I found the best approach is to take a prior snap shot and compare that against your changes. After a while you learn what to look for.
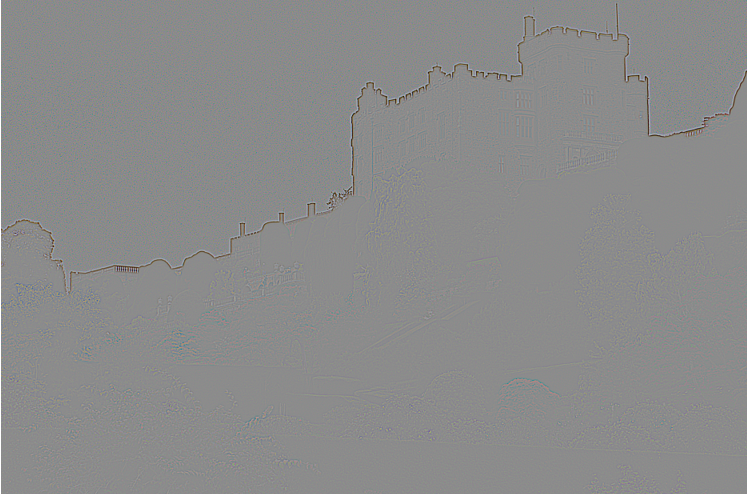
If you drag up each node in turn as high as it goes and then increase the mix you can get an amplified effect to visualise the wavelet frequencies at that node. See the notes on my feature request (link in my post above). It’s not perfect and you need to zoom in to see the higher frequencies.
I beleive an additional complicating factor is that the highest spatial frequencies in contrast equalizer won’t impact the image unless it’s fully zoomed in. You have to select the node closest to the right-most dark bar to make a difference… anything to the right seems to have no impact.