BTW, I just changed the title, category and tags to reflect the thrust of this thread. Let me know if this title is okay and / or feel free to refine it if you have the privileges.
G’MIC can be useful for testing curves:
gmic 256,1,1,1,x/256 -dg 400,400,1,1
Which gives:

So perhaps a mirrored gamma curve : 1-(1-x)^g
gmic 256,1,1,1,x/256 -oneminus -^ 2.4 -oneminus -dg 400,400,1,1

In any case a LUT will usually help speed wise.
2 Likes
Thanks for those, I think I managed to do all the heavy lifting now, in that what comes out of the script is what would be projected by an enlarger. It’s colors and intensities are correct. This curve is for the paper the ‘personality of which I am not try to model’ as it has a very constant gamma, except for the toe, which is where I want a little bit of highlight compression.
This will allow me to use a ‘better’ exposure in my inversion.
Yes that’s what I intend to but the math’s is hard for me, and toe curve has to be applied at the time of inversion, as optimum exposure creates values greater than 1.
At the moment I just let them clip, or choose a less than optimum exposure and adjust in RT.
The size and shape should be fairly straight forward as I believe it is precisely defined, there are not many choices left to choose from in the world when it comes to photographic color paper. This toe, which is now a shoulder will suffice.
Thanks and this thread has helped me a lot.
Will have a look at that, maybe that will help figure out to apply such a curve “inline” with my inversion.
![]()
The curve needs to be applied to values of:

Where K is the exposure, Jn is the normalised intensity of the pixel and Yp is typically 1.8
at that font size I can take off my glasses 
1 Like
I find the source of that formula tricky to follow, but not because of the maths - certain ‘leaps’ seem to be made without explanation. Still reading it on occasion…
If the optimal settings result in values being clipped and you’re looking for a way to compress rather than ‘lose’ them, it suggests the curve/formula itself has an issue for your input.
Edit: some explanation of it may help
The formula written in another way is just (K/J^p)^c where J represents the set of all pixels (but this equally applies to any one pixel individually). Rewritten it can be K^c * J^(-pc) and given that K is some constant of your choosing and we can normalize to any range, it may as well just be J^(-pc).
In other words, this is equivalent to reciprocal then gamma, or simply a negative gamma exponent : J^-g
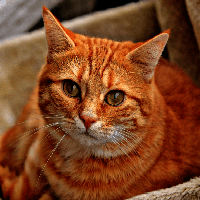
A demonstration of this using gmic… let’s start with a cat image, negate in the ‘digital’ sense then normalise to your input range:
gmic -sp cat -negate -n 0.1,0.5
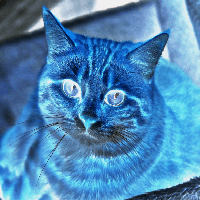
At that point it’s negated. Now try a negative exponent and normalise at the end:
gmic -sp cat -negate -n 0.1,05 -^ -0.2 -n 0,255
That’s really all that’s happening with the formula.
Just to be clear, it’s basically saying negate with 1/x instead of 1-x. Then you can apply a usual gamma/tone curve in whatever editor you like so long as it has sufficient gamma range. That of course ignores any colourspace or normalisation…
1 Like
Not sure I can explain it fully, as I have followed the approach contained in the documents published, which I believe is the foundation of the colorperfect product:
What does the negate do to the pixels in gmic? is it something like (QuantumRange - pixel)
I get what you say, though it takes me a lot longer. ![]() Though your discussion has made me realise that the highlight compression done by the Photographic paper, can probably be implemented independently, and perhaps that step is not that critical after all as it can be done later. Though I guess only testing will tell.
Though your discussion has made me realise that the highlight compression done by the Photographic paper, can probably be implemented independently, and perhaps that step is not that critical after all as it can be done later. Though I guess only testing will tell.
It’s probably best, that I finish off the last, bits of the work, I was working on and get it on gitbhub.
Sorry I worded that badly - I meant that I was trying to explain it.
gmic -negate is 1-x, but accounting for the range of values (subtract min, subtract from new max).
My point is the whole formula boils down to using a reciprocal to invert, the rest is just setting gamma as you might normally. The article/formula is just a very long winded way of saying ‘use reciprocal for film negative’.
Please share what you have so far, with examples and sample files. It is difficult to discuss without something more concrete; e.g., @garagecoder had to use a cat photo to illustrate his point ![]() .
.
This compression shouldn’t be done much later but right after linear exposure compensation and before gamma correction. You mentioned that JN represents a normalized intensity value. Normalized suggests that the pixel value is already different from the one recorded by the input device, unless the device itself does the normalization, in which case the data is no longer linear.
If accuracy is your aim but you would still like to do some highlight compression to the linear data, then it would be appropriate to compress the highlights only and leave the rest of the data uncompressed and linear. I.e., you only normalize the portion above 1 and the portion in the highlights you are willing to de-linearize.
Finally, check out websites like http://mathisfun.com to brush up on your math. I didn’t mention it before because I didn’t know your proficiency. There is no shame in looking things up once in a while. I do it too.
For a more advanced discussion, check out Filmic Tonemapping with Piecewise Power Curves – Filmic Worlds, which I found quite illuminating. @Carmelo_DrRaw’s PhotoFlow (linear_gamma branch; latest unstable release) has two implementations of this filmic tone mapping method.
Unfortunately I don’t have permission to share the scans, but I will create some more than I can share.
But garagecoder has given me the idea “simulate the scans by creating a digital negative of existing digital images”
gmic -sp cat -* 0.000004 -^ -.5 -d0
creates a simplified simulation, as this film has no toe or shoulder, mask and each layer (channel) has the same gamma. I gave up with gmic as for the moment as I don’t have the time to invest learning something new right now. But If I had added those additional things, you can easily see that reversing it is no longer simple.
This is covers a lot of my goal but in reverse, and calibrated to the characteristics of the emulsion.
I will take a break from this for a little while, thanks for the help so far.
1 Like
I put a first cut of the scripts/tools on git hub, I have called it scantools:
The goals are to create a FOSS solution for inverting negatives that:
Provides a practical workflow, such that no significant decision needs to taken at scan time. i.e. Scan once and never again.
Provides a very high quality inversion that needs minimal refinement
Provides an input into tools like RT that is optimised to complete that refinement.
Invert scan: has a couple of different ways to try an invert the scan: not sure yet what is the best.
The rest, of the scripts allow you to use a flat bed scanner to scans all the film that will fit on the platter in one pass.
Its far from finished but a start.
3 Likes
If anyone is still watching this, I am still moving this along 
I could use some maths assistance, I been researching various techniques, the filmic one posted here etc.
What I think I need is function, where values greater than say .8 are progressively scaled such that 1.2 becomes 1, any tips?
I am a professional mathematician. What you need is to shrink the length 0.4 to 0.2 so why not multiply by the factor 1/2? So the function is
f(x) =x for x upto to. 8 and then x+(x-0.8)/2 up to 1.2
Is this what you want?
Thanks shreedhar.
I think so, that’s very helpful !, so easy to get yourself tied in knots, that you can’t see the wood for the trees. BTW I am trying to fit this part of a curve before a power function is applied to the normalised values.
Thanks alan, that’s very detailed I have been researching lift,gamma,gain.
Actually I now realise I want to apply a curve to the value from .8 to 1.2. and leave the values below .8 alone. (.8 and 1.2 are just illustrative, I would like to parametrise them)
Yes, my “power method” applies a curve just to the highlights, leaving values below 0.8 (or whatever you want) untouched. It can also apply a different curve to shadows, leaving values above 0.1 (or whatever) untouched. Values between the limits are unchanged.
In Power curve for shadow, mid and highlights, I show how to get a single power curve that changes all values, giving required values at the top, bottom and somewhere between. This is pretty much the same as lift-gamma-gain.
My pages at im.snibgo.com use ImageMagick and Windows BAT scripts (yeah, I know, hawk spit), but I try to explain enough so the concepts can be applied to any platform.
Thanks Alan,
I have been going through you scripts I converted the graph1d and graphline scripts to bash, that is very helpful to visualise things.
I am busy studying stepwise polynomial’s
I have two math questions that may save me a lot of time…
- In the filmic tutorial the author says “Given those points, how can we form a continuous curve between them? One option would be polynomials, but that does not work well. These changes can be pretty sharp in linear space and fitting to polynomials will sometimes have undesirable concavity changes. Instead, we are going to use power curves.”
Should I just ignore that comment, as it doesn’t make all that much sense, I thought with polynomials could you can match any curve?
- Am I correct in understanding that for polynomials all exponents must be positive?
In standard polynomials, yes, all exponents are positive integers. If x is the input and y is the output, a polynomial of degree 2 is:
y = ax^2 + bx + c
So three parameters (a, b, c) specify the polynomial. Beware that some people write this as:
y = a + bx + cx^2
If we have (n) known correspondences between x and y, it is true that a polynomial of degree (n-1) can be found that passes exactly through those given points. But what does the curve do between those points? Sadly, it often does stupid things, going madly beyond what a human would consider sensible or desirable.
For that reason, we often prefer a series of joined paramaterised cubic curves (or Bezier curves or B-splines, they are all variations of the same thing). Each curve starts and ends at two of the desired points but its shape is influenced by two other points. Each curve joins to the next curve at one point, and has the same slope and curvature.
Bezier curves passing through given points more closely follow what a human would draw. Gimp and other editors use them in the “curve editor”. (Though I don’t like the Gimp curve editor because it can cause clipping.)
A power curve, in the form …
y = a*x^p + b
… has parameters a, p and b, and these have fairly intuitive meanings (“gain”, “gamma” and “lift” in some editors). They are easer to calculate than Beziers, and are better-behaved than polynomials.
EDIT: corrected the counting of degrees.
1 Like
This is a quadratic polynomial, not cubic. In general, due to the constant term, one needs n+1 constants to describe a polynomial of degree n.
Oops, yes, thanks for the correction. I’ve fixed the post (I hope). Degree (n) means there are (n+1) terms, and thus (n+1) coefficients.
No it doesn’t. Degree n just means the highest power present is n. Lower powers might have zero coefficients.