Basically, G’MIC processes every pixel in the xyz order. I want it to process by rows, columns or tiles. If I use crop, it will crop for every pixel rather than the number of rows, columns or tiles.
The reason I used crop is that I thought that you wanted the values using the formula specified by your libreoffice sample.The small image is used to speed up the process, and you can use : or * in the beginning of the small image. In fact, this was a technique I used for rep_axis_streak where either row or column are processed in the parallel, and this speeds up the process much faster than if it were done via serial processing.
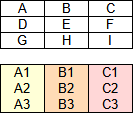
E.g., instead of processing from A…I in xy order, I want to process A1…A3, B1…B3 and C1…C3 in parallel. But if the Bs required values from the As, then A's would be retrieved, since As are processed before Bs. So, there are two cases: a) sets are processed in isolation and b) sets depend on previous sets.
gmic (0,0;0,0;1,1;2,2;3,3;4,4;4,4) s x Acolumn a x
where Acolumn processes the columns in isolation, but I want to learn how to do it entirely in the math interpreter so that a) I don’t have to alternate interpreters and b) I can do more sophisticated things such as (overlapped) tiling, and c) use and preserve high precision if needed. I am not a natural at coding, so it is hard for me to know where to begin or even read others’ code examples.
Actually, that would be a good solution. However, it’s a slow approach. Hence why I think parallel_for should be a thing and that should only work only in serial processing i.e “>”.
In that case, you have to split your image first into different columns, and use a fill on each one to do the computation of all their values in parallel.
In the fill, you can still access the values of the other columns if necessary (with i[#ind,pos]), where ind is the indice of the column image you want to access).
Not if you enable parallelization. In the math interpreter, parallelization is all or nothing.
You cannot say : “parallelize only the computations for the first column, then for the second, then for the third.”
True but I am still used manipulating images outside of the math interpreter, so I will be using shared for efficient processing. Also, more intense changes require a combination of multiple fills and evals.
More importantly, if I want to compare two images, it makes complete sense for us to see the two images being compared alongside the scatter plot.
I’m now working on alphabet-related task. Here’s my question:
Let’s say I have 6 inputs. The command I want will loop through variable of alphabet starting a to z and assign each inputs to each letter.
How would I create this command?
Something like this if you catch my drift.
 id=0
 forloop(#input){alp(id)=$(id+1)}
If you’re curious on why, I’m creating a new attractor function that improves upon rep_trsa, and I will rename Attractor to TR’s Strange Attractor, and then make the new attractor filter as Attractor.
Each inputs after the first one correspond to the letter, and after z, it corresponds to aa, ab, and ac. In addition, I would like to assign the inputs to the corresponding variables. Like id_a=$2 and id_c=$4.
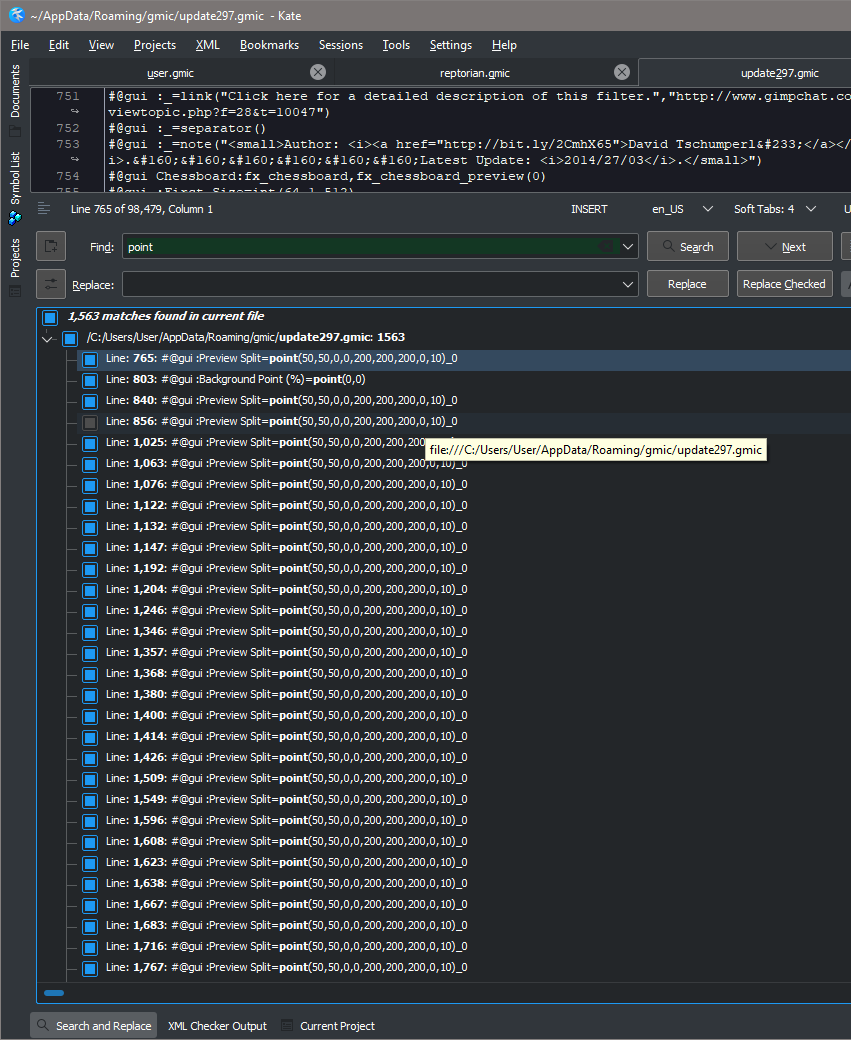
Question. This would go to @David_Tschumperle. On GUI element, when using point, what does the ? in point(50,50,?,?,200,200,200,0,10) mean? I change them, but they do nothing?