Beware that normal cameras usually make poor colorimeters, because their spectral sensitivities aren’t much like the human eye.
You will get the best accuracy if your test chart is spectrally similar to the real world objects that you wish to photograph. Paint chips may or may not have a similar spectral characteristic to orange skin - you would need a spectrometer to figure that out.
In industrial and scientific situations, the correct path would be to use cameras specifically designed to capture colorimetric or spectral information. Such cameras are available, but are likely to be much more expensive than consumer or semi-pro photography gear.
[EDIT: I’d forgotten that dcraw assigns an XYZ profile, so there should be no need to assign her XYZ profile with an initial “-profile XYZ-D50-Identity-elle-V4.icc”.]
You can then use ImageMagick on the Lab image to do simple statistics (mean, standard deviation, etc) on all or part of the image, or spit out the pixel values in CSV or other format for external software to analyse.
Elle knows far more about getting accurate colours than I do.
As a side-note, I’ll suggest that a better approach might be to skip the de-Bayering.
Huh? Well, we don’t care about detail within the image. We care only about some kind of average colour. Assuming the camera is RGGB Bayer, we could make a TIFF with no de-Bayering (dcraw options “-o 0 -6 -r 1 1 1 1 -g 1 0 -D”) , then make one output pixel from every four inputs, taking red, blue and average green values from the appropriate corner of the input square.
I’ve never tried this, and don’t know if this would give more or less accurate results.
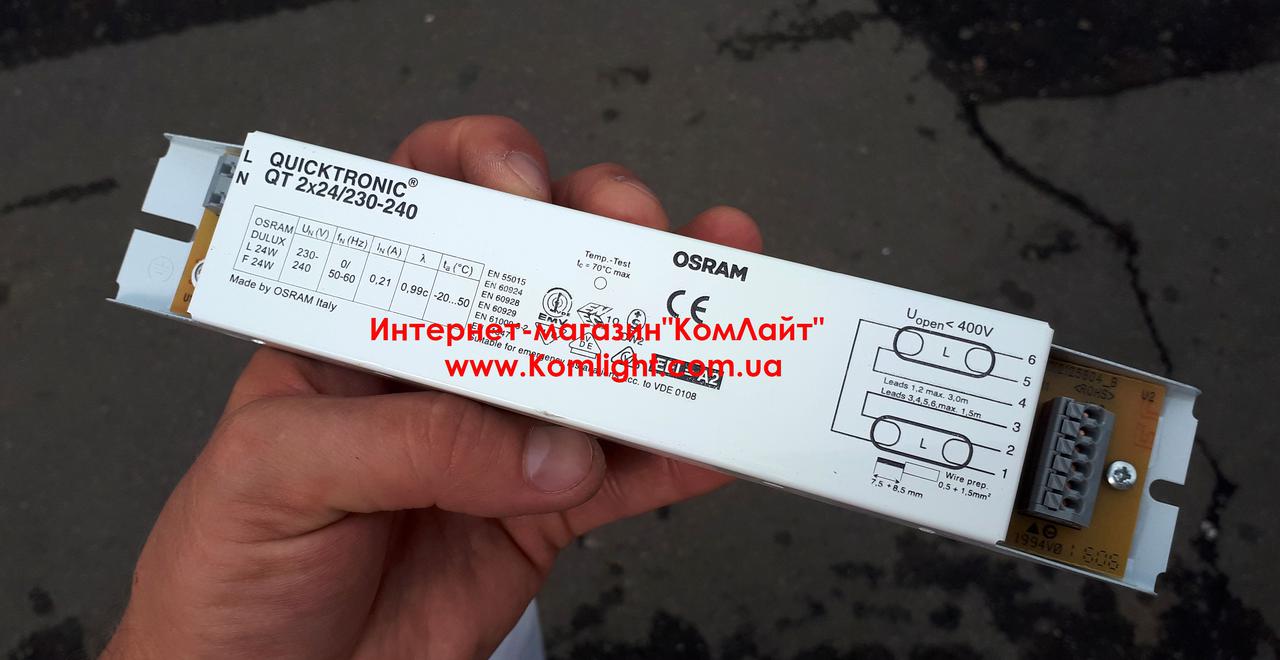
My lighting system is composed of 2 Quicktronic Osram Dulux (just like the one on the image) with 4 Osram Dulux L 24W / 12 disposed in a square shape. In the square shape formed by the lights there is a 5 cm thick square of glass (maybe frosted glass) with a round hole in the center. On top of the glass, through the hole is placed the camera lens. (Not very easy to explain but I hope you understand)
From what I could find on the internet, according to Osram The Color Rendering Index (Ra) is superior to 80 or superior to 90 (depending on the precise type of the light). Unfortunately I don’t think I have the time to set up another lighting system.
Although, I found a scientific paper by Leon & al. (2006) untitled “Color measurement in Lab* units from RGB digital images” in which the illumination was achieved with 4 Philips Natural Day-light 18 W fluorescent light (60 cm lenght), with a color temperature of 6500 K and a color index (Ra) close to 95%.
Do you consider that CRI of more than 90 is “low CRI” ? Sorry for these “novice questions”.
Apparently, in this paper, they managed to get reasonably small errors compared to a commercial colorimeter (Hunter Lab)
Yes, we own a portable colorimeter BYK. As I said, this device is only able to give Lab* measurements for really small portions of area (not representative of the color of the whole bunch of orange peels, unless I do 100 measures) and I thought it would be more interesting to get the values of Lab* for all the pixels of the peels. But yes, setting up a colorimeter based on analysis of photos is much more complicated than I thought it would be!
The even diffusion of the light is the purpose of the 5cm thick glass I guess.
I will be taking photos (if hopefully I manage to solve everything out) during only one week.
I have no clue about Bayer and de-Bayer. But my camera is a Canon DS126621 with a Lens SIGMA 17-70mm F2.8-4 DC MACRO (Filter size: 72 mm)
My knowledge of CRI is just based on reading stuff readily available on the internet, so that doesn’t make me an expert, just makes me a novice who did a lot of reading maybe ten years ago before purchasing two CRI 92 D65 fluorescents for my tabletop photo studio (since then I replaced those fixtures by more flexible light boxes and spot lights, but that’s irrelevant to the current discussion).
My “takeaway” point from all the reading was that CRI 92 was pretty much a minimum “good CRI” for photography, 95 is really good, and that anything under 90 was not good - the “goodness” scale - new technical term I just made up - isn’t linear, declines rapidly as the CRI numbers go down. Perhaps @chris can comment on the question of CRI numbers (see Using Hald CLUT to modify CRI of light source? - #3 by chris). Point of suspicion regarding these numbers: I find it somewhat suspiciously convenient that the highest CRI fluorescent then available locally (in a specialty lighting store, not in regular stores) had the magical 92 CRI. Maybe published “good enough” figures go up as the commercially available maximum CRI goes up. But from experience I’ll confirm that CRI 85 LED bulbs make awful lighting for taking photographs.
I’m guessing that research is like photography in the sense that if we all sat around waiting until we had the best possible equipment none of us would get anything done. I’m hoping that a good thing that results from this long thread is that you’ll have a working understanding of limitations on accuracy of the data you collect, which of course all data has limitations. The important thing - as I’m guessing you are already very well aware - is to try to figure out what those limitations on the data actually are, and try to provide checks and estimates of error where possible. You have access to a portable colorimeter, so that’s one available check.
Another check is to make a target shot of your Spyder Checkr 24 and go ahead and make a matrix profile. As @gwgill said, there’s just not enough color patches on this target chart to make a LUT profile, and probably not even a shaper matrix profile, but rather just make an “-am” matrix profile. It would be interesting to compare the deltas from the specified LAB values in the SpyderCheckr reference file, to results from your custom camera input profile vs results from the standard default matrix supplied by dcraw, which matrix profile is also available through the various free/libre raw processors.
Another check is to put a solid uniform gray piece of paper or better yet maybe a sheet of white or gray PVC plastic in the space where the product will be, and photograph this blank surface to get an idea of how uniform the lighting actually is and whether there are any hot spots from glare.
@afre raised an interesting question regarding the color of oranges vs LAB and vs taking photographs with a camera. I did some rudimentary checking using a photograph of an orange that I made earlier this year - oddly enough my goal was to get an idea of the LAB values of an orange - I was painting a picture of an orange and wanted an idea of “how orange is an orange”. I also checked the orange photograph’s LAB values against a photograph of an IT8 target chart - some cameras have trouble with high chroma yellow and orange has a lot of yellow in it, but I think actual oranges have a low enough chroma to not wander into the problem areas for camera matrix input profiles. I’ll post images and results in a bit.
[quote=“Elle, post:35, topic:9281”] @afre raised an interesting question regarding the color of oranges vs LAB and vs taking photographs with a camera. I did some rudimentary checking using a photograph of an orange that I made earlier this year . . . and also checked the orange photograph’s LAB values against a photograph of an IT8 target chart - some cameras have trouble with high chroma yellow and orange has a lot of yellow in it, but I think actual oranges have a low enough chroma to not wander into the problem areas for camera matrix input profiles. [/quote]
OK, here’s the orange. The odd white pipe is just some PVC pipe that I put up there to get a quick white balance. The sample points show LCh instead of LAB. LCh is just a simple polar transform of LAB, so if you already have LAB, it’s easy to calculate LCh and vice versa. The reason I show the LCh values is it’s just easier to visualize what’s going on. “h” (hue) is the angle measured counterclockwise from the positive a axis on the CIELAB color wheel. And “C” (chroma) is just the distance from the intersection of the a and b axes, where a=b=0. These values are perceptually uniform (to the degree that LAB itself is perceptually uniform).
OK, what makes LCh easier to visualize for the current purpose is that the problem with simple linear gamma matrix camera input profiles have trouble with bright high saturation yellows, where saturation is defined as the ratio of Chroma to Lightness. Notice the little magenta triangles in the LCh values for sample points 4 and 5 in column 15 and sample point 6 in column 22. Those little triangles mean the color of these patches is “out of gamut” with respect to the sRGB ICC profile color space. This means one of the channels - the blue channel for these bright saturated yellow colors - has a channel value that’s less than 0, a “negative” channel value. The measured LAB/LCH values are still accurate. But such channel values are not good for general editing.
I’m guessing you won’t be photographing any bright yellow oranges because hopefully there isn’t such a thing. The orange colors seem safely within the color gamut a camera can handle.
Edit: Oh, I forgot, here’s the it8 reference file so you can match up the (single-point) Sample point values with the measured values - the values aren’t super close partly because the chart was really old when I photographed it, but it helps give an idea of “how close” the camera profile matches the photographed colors to the original colors on the chart R080505.it8.zip (10.8 KB)
Edit 2: Lost the forest for the trees, sorry! the whole point of the it8 chart and zip file, and the sample points in the column of yellow color patches is that simple linear gamma matrix camera input profiles tend to get increasingly inaccurate, higher errors - greater differences between the nominal color of the patch and the color assigned by the input profile profile to the target chart shot - as you look at the higher saturation yellow colors. This is a separate issue from the fact that these color patches are out of gamut with respect to the sRGB color space (some of the other patches also are out of gamut wrt sRGB, but they don’t have high errors when evaluating the matrix input profile).
Sometimes people will even just edit the relevant text files when making a camera input profile, to just remove one or more of the brightest most saturated yellow patches, which does allow a better match to the remaining colors. I doubt there are colors on the 24-patch Spyder Checkr chart that can be removed - there just aren’t enough color patches. But if oranges were bright saturated yellow instead of orange, I suspect using a photograph to measure LAB values would produce very inaccurate results.
But there is a complication going on. GIMP is an ICC-profile color-managed editing application, which means all the colors are relative to the D50 white point. And I used the white PVC pipe to white balance the image to D50. But when I was matching the actual color seen on the screen visually to the color of the actual orange sitting next to the screen, illuminated by halogen track lighting, getting a visual match did require using colors of orange on the screen that are outside the sRGB color gamut.
I’m guessing that science and technology publications expect LAB/LCh values that are relative to D65. And I’m guessing that if there is a monitor in your workplace, and if it’s calibrated at all, it’s also calibrated to have the D65 white point (and hopefully it’s also profiled so you can actually see accurate colors, but that’s another issue outside the scope of this thread).
Also some of the software you are using is ICC profile color managed, and some is not. You can’t just measure LAB values relative to D50 (ICC profile color-managed colors) and expect they will match the same LAB values measured relative to D65. A spreadsheet can be used to chromatically adapt back and forth. But keeping the white point straight is a very important thing to do.
I don’t ever deal with software that doesn’t use ICC profile color management. Maybe @gwgill , @anon11264400 , @snibgo , @KelSolaar might have advice on this issue.
Speaking of spreadsheets, setting up conversions from RGB to XYZ to LAB or from XYZ to LAB is straightforward. If you use imaging software such as imagemagick, imagej, etc it’s a good idea to check to see if the values that are produced match hand-calculated values.
ArgyllCMS xicclu is 100% reliable for values relative to D50 (ArgyllCMS is an ICC profile application).
@KelSolaar 's “colour” KelSolaar (Thomas Mansencal) · GitHub can return values for arbitrary white points including D65. Example “colour” commands for color space conversions are sprinkled through this long and very interesting thread - well, I learned a lot and thought it was very interesting, hopefully other people did too :
Hm, I am lacking much practical experience regarding photography with LED/fluorescent lights here, but I perfectly agree with what you said. Furthermore, from artificial light source to printed image there are lots of colour issues to be considered. Most cameras are made to give pleasing results and not colorimetric correct numbers, and the colour response (transfer functions) of the bayer pattern and the spectral response of the light source may or may not fit well together. Decomposition of a light spectrum into 3 components based on what we think how the human eye works will always lead to an incomplete representation. IMHO, the science that goes into that part (bayer filter transfer function and what it means for the system) leads to the differences in colour rendering of the different camera brands many people swear on.
For me, this means practically that for photography, the proof is in the pudding and extensive testing is the route to go. For colour measurements, a camera may be the wrong tool. And information that is lost at the illumination or at the bayer pattern cannot be reconstructed, it can only be estimated based on the assumption on human vision, but the application is then limited to human vision as well. Or painted in based on assumptions on the scene.
That’s a really nice link - thanks! And thank you @snibgo for the examples on this page: http://im.snibgo.com/ - that “Linear camera raw” link seems very interesting. If one’s camera deviates too far from linear response, making and using a simple linear gamma matrix input camera profile isn’t such a good idea. I confirmed the linearity of my old Canon 400D a long time ago, but never did bother to check my Sony A7.
The Spyder Checkr 24 is listed as a supported target chart for use with ArgyllCMS: Argyll Usage Scenarios
The software mentioned in the “SpyderCheckr possible ?” thread uses ArgyllCMS “under the hood” so to speak. So whatever the manufacturer of the target chart intended, it can be used without having access to Lightroom/PhotoShop/Phocus.
As long as you photograph everything you need, the oranges, the target chart, hopefully also a uniform white or gray surface for checking uniformity of lighting, anything else belong here? then the actual making of the camera input profile can be deferred, isn’t necessary until you actually start processing the raw files.
The biggest thing that will make the target chart shot not as good as it otherwise would be is glare on the chart, which hopefully there won’t be. You can tilt the chart if need be - ArgyllCMS can compensate for a tilted chart. The next biggest would be light fall-off towards the edges of the frame - keep the chart and hopefully the product centered in the middle of the frame and only fill about half the frame to minimize light fall-off, and include a shot of a plain surface to get an idea of how even the overall lighting is.
Also people tend to underexpose their target chart shot. To avoid this “underexposed target shot” issue, a lot of people will set up the camera and target chart, and then shoot a series of exposures, each time raising the exposure until they are 100% sure that portions of the target are blown, and then make a few more even longer exposures just to be sure - the little image shown on the LCD is almost never a good guide to optimal exposure.
I vaguely recall Lab being Illuminant C, but don’t quote me.
The discussion of capturing the scene colours is sort of a misnomer. For a single source, fully diffuse subject, the albedo peak reflectance is captured at 1.0. This of course is rarely to never in the capture of a typical photograph.
Given that a scene colour is defined by the ratios of light, it is fundamentally impossible to display them on a screen given the above facet as we can’t replicate the ratios. It would be of course possible to take the scene referred ratios to a JzAzBz encoding model and attempt to compress the dynamic range and then communicate the colour back into the ratios, but that too likely ends up aesthetically “odd” relative to historical precedent.
TL;DR: It’s impossible to replicate the scene’s colorimetry in reduced dynamic range scenarios without trade offs.
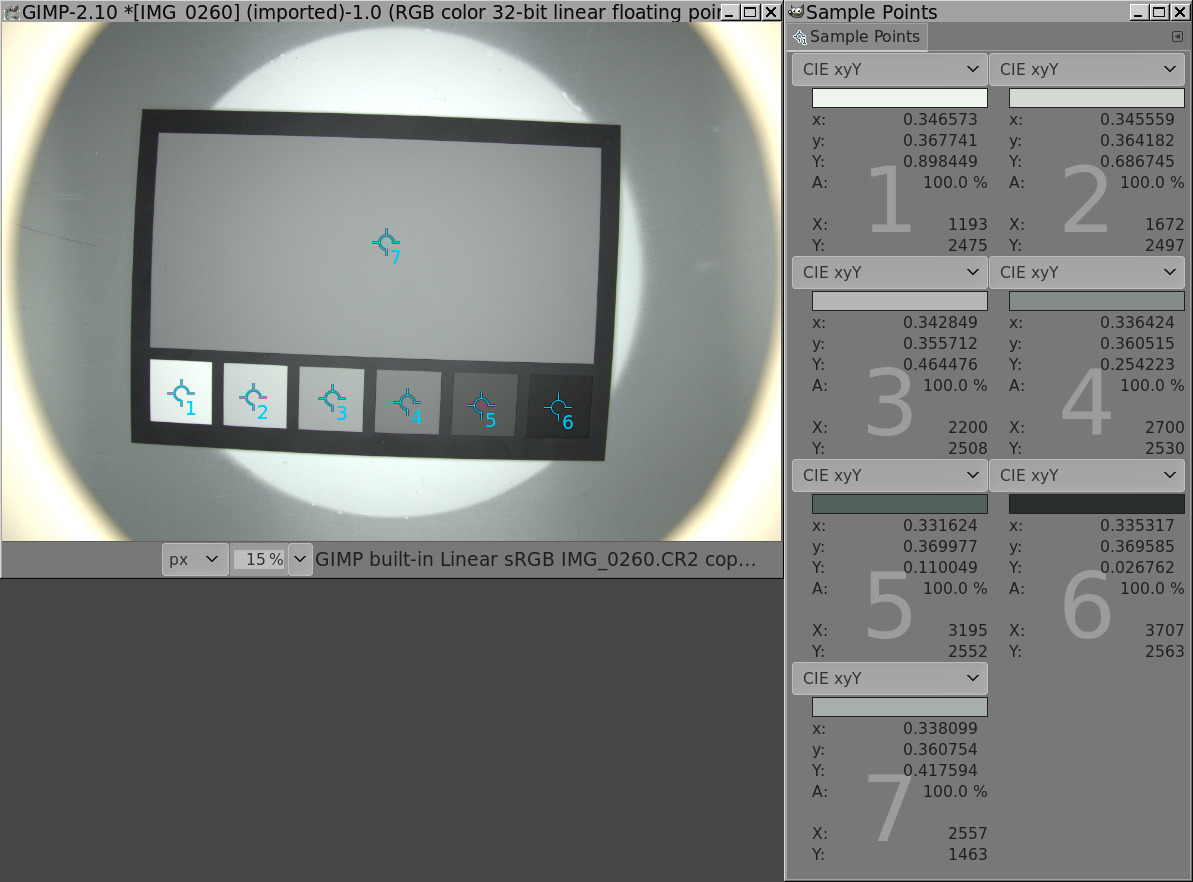
I photographed the gray surface of the SpyderCheckr in the box. This is the RAW file that I obtained IMG_0260.CR2 (20.6 MB)
Unfortunately, the L* varies a lot between the center of the white circle (supposed to be the place where the product will be) and the edges…!!
To be a usable tool, my impressions are that the set up of the box and the lighting should be redone from scratch…
Reducing the area where I will put the orange peels could be an option to get more accurate results, but then the measure of the Lab* thanks to analysis of photo looses a lot of interest to me. My goal was to be able to analyse the color of all the peels belonging to one “batch” in 2 or 3 photographs.
In addition, in this set up it means that I am not able to photograph the SpyderCheckr with constant lighting.
What do you think ?
Within the main rectangle, the lightness varies, but the chromaticity (the a* and * channels) is fairly constant.
(Contrary to my previous suggestion, I used the white balance from the camera.)
L* varies between about 10% and 19.9%.
a* varies between about 48.5% and 50.3%.
b* varies between about 49.5% and 50.4%.
(On this scale, a* and b% are neutral at 50%.)
The variation in a* and b* is local, rather than global. This suggests the chromatic variation is from the card, not the lighting.
The variation in L* is more global, with a range of 10%. In the OP, you say:
Unless the variation in the L* of the oranges is massively more than 10%, I’m afraid the results won’t be satisfactory.
If your subject was flat, like a document, you could adjust the L* values to compensate for uneven lighting. But your subjects are spherical, so this adjustment can’t be done.
The variation of the L* due to differences in maturity between 2 different types of colors is likely to be about 15 or 20, but anyway the “calibration” cannot be done properly I think…
Can you share a photo or diagram of the box? A diffusion screen between the lights and oranges will help. Perhaps the lights can be rearranged.
Have you considered using a ring flash? I have no experience, but I expect this gives a constant illumination, provided the distance from camera to oranges is sufficient.
See what other people say. My experience is limited.
I think this is an important observation. If you’re looking to measure the specific spectral response of a material with the available tools, I think you need 1) consistent lighting in both temperature and coverage, 2) take a relatively small patch from the image consisting entirely of the material in question, and 3) apply a ‘smoothing’ (gaussian blur?) function to it to average out.
Then: do your LAB conversion.
I did once try a home-made ring flash (my husband is a genius at creating such things). The illumination was incredibly diffuse and even, totally too diffuse for the particular thing I wanted to photograph, no shadows at all. Anyone else have experience using a ring flash? I was making a macro shot of a small pine cone, so no idea how it would work for other setups.
Copy tables typically use two long light fixtures (perhaps high CRI fluorescents) angled at 45 degrees from the item to be photographed, one from each side. The book “Light Science and Magic: An Introduction to Photographic Lighting” has excellent instructions and diagrams for photographing just about any conceivable surface. It’s available through Amazon etc, and even my local library had a copy so it’s not hard to find - highly recommended for anyone who wants to know more about proper lighting for various purposes.
I looked at the raw file using GIMP via the darktable raw plug-in, and tried to compare “Y” (from XYZ) values to the nominal values the chart is supposed to have. I used a modified version of babl and GIMP (many thanks to Pippin and Massimo: Add xyY color space conversions to CIE.c (#22) · Issues · GNOME / babl · GitLab) and used Levels (had to adjust both exposure and black point) to set the brightest and darkest patches along the bottom to match values given in ArgyllCMS “SpyderChecker24.cie”, relying on information given here regarding the gray patches on the back of the target chart: https://www.datacolor.com/wp-content/uploads/2017/05/SpyderCheckr_24_UserGuide_EN_v1.pdf
FWIW, I agree with what @snibgo and @ggbutcher said - the current setup doesn’t really seem sufficient for the kinds of measurements you want to make. It might be worthwhile to make your own lighting setup. But if you do, I think you’d still need to put the items to be photographed in the center of the frame, maybe one or or most three or four product samples at a time, to keep lighting as consistent and even as possible and avoid light fall-off from the camera and lens, which probably accounts for a fair amount of the light fall-off from center to edges of the chart as photographed in the raw file.
In my posts, I have tried to provide hints to direct the conversation in certain directions, which may or may not be relevant to our conversation. E.g.,
A quick web search brings me to the following. We might be able to glean something from what people have done previously.
In the articles I linked to in the LCH color palette article, doing a quick check, many used spectrophotometers. However, this study of phlox colors used a scanner, which nicely solves the problem of setting up a light box, but does likely require making a custom scanner profile and of course finding a decent scanner: https://etd.ohiolink.edu/!etd.send_file?accession=osu1429694764&disposition=inline
Thank you @afre for directing the discussion to what’s already been successfully done using digital images rather than spectrophotometers!
Doing a quick scan through of the articles you linked to, one of the studies did use a light ring. One used a black surface and black lining to the box surrounding the item to be photographed. In the setup that @MarionGaff1 is using, it almost looks like there’s a bottom bright ring around the edges of the box, which surely would contribute to flare in the camera.