Thank you Claes!
To the human eye it looks like there are vertical stripes. But the variation of L a b is considerably smaller than with my lighting set up.
Thank you Claes!
To the human eye it looks like there are vertical stripes. But the variation of L a b is considerably smaller than with my lighting set up.
Sure - but the same caveats apply in terms of chart spectral character in relation to the target objects, as well as scanners (typically) being even less close to a human observer than cameras.
Note that photographic or printed targets are a lot less like real world object spectra than targets composed of individual pigments like the ColorChecker.
I tried to cover the inside of my current box with black paper, but I still had the same variation in L* as before (L* higher at the center of the box and going down when directing to the edges).
And if I put my lighting system (the 4 fluorescent lights in a square shape) down in the box (at the same level as orange peels), I am afraid the issue is going to be the contrary. L* higher on the edges of the gray patch. I did a trial putting the target chart at the same level as the where the lighting system is now (= in the “ceiling” of the box) and here is what I got : IMG_0252.CR2 (21.1 MB)
I guess the distance between the lighting system and the object to photograph is very important
@Claes - are those vertical stripes from the scanner itself? or from the way the fabric is stretched?
It sounds 100% reasonable that charts with individual pigments would make a better camera profile than photographic/printed targets, being more representative of real-world surfaces. But from curiosity, are there studies/comparisons showing actually measurable increases in color accuracy of camera profiles made with the Wolf IT8 vs 24-patch ColorChecker vs 140-patch ColorChecker vs other targets? I’ve seen reviews of various IT8 charts, which seem to show that the Wolf targets are very good IT8 charts. But I’ve never seen comparisons that included ColorChecker charts.
Is there only one manufacturer of the ColorChecker chart, that being X-Rite? Is X-Rite owned/run by Munsell?
https://munsell.com/color-products/other-products/x-rite-colorchecker-targets/
https://www.amazon.com/X-Rite-MSCCC-ColorChecker-Classic/dp/B000JLO31C - the page also has links to other versions of the ColorChecker (including the 140-patch chart).
I’m guessing part of the light falloff you are seeing is from the camera/lens itself. You can check this by taking the camera outside into the shade of a building on a sunny day, or anywhere on a completely overcast day, and shooting a solid-color neutral gray target. Shaded side of a building on a sunny day, and completely overcast days both make totally diffuse light so you don’t need to worry about glare or uneven lighting hitting the target.
It’s normal for camera/lens to have light falloff from the center to the edges. The degree varies depending on which camera and which lens. This is why the advice when shooting a target chart is to only fill the center third or half of the frame with the target chart, depending on how much light fall-off there is.
For your purposes, I’m guessing that it’s best to only use the very center of the frame for photographing the orange peels.
Maybe a circa-50mm prime lens might produce less light variation across the field than the zoom lens? Anyone know?
Would “flat fielding” help with increasing the evenness of light across the frame, allowing to photograph more orange slices at a time? Is this process relatively straightforward using darktable/RawTherapee/etc?
If I’m correctly picturing what you describe, this setup might lead to fairly significant amount of flare in the camera as the lights would be shining up into the camera lens, which might fairly much decrease contrast in the resulting images - check the ratio of the light from the brightest to the darkest patch, compared to other placements of the light sources. Some lenses are hugely more sensitive to this than others, but it’s always a factor, might be better to keep the light sources above/behind/to the sides of the lens.
are those vertical stripes from the scanner itself? or from the way the fabric is stretched?
Unfortunately, they are introduced by the scanner’s travelling light.
/Claes
The 24-chart I use on Colour checker charts and other web pages comes from a British manufacturer, https://greywhitebalancecolourcard.co.uk/ . The chart is printed. The web page shows a scan of the chart (from a consumer-grade Canon CanoScan 5600F scanner).
I don’t know how well the spectrum from orange peel matches those from orange patches of a painted or printed colour chart. Adjustments using a profile from a chart may give good overall accuracy but with local inaccuracy. We want good local accuracy in the gamut of orange peel samples, and don’t care about other colours.
This is why I suggested earlier that we ought to focus on colours that are close to the subject range and have cards or charts representative of them; e.g., using soil charts for soil colour matching. If a chart or strip with only orange colours isn’t available, then you would need to be creative. Cut them out or make known orange surfaces and measure them using your colorimeter.
Edit: Also, when you take the an image of the references, place it in the location where the peels would be in a separate shot. So, in the end, you would have two shots, peels with the reference and the reference by itself where the peels were.
Other remarks:
– Peels: would it be possible to flatten them?
– Camera: would it be a good idea to attach a filter of some sort to mitigate some of the problems introduced by the lighting? Or would that introduce more problems like unpredictable colour shifts?
@MarionGaff1 I suggest that you give things a try yourself and report back. We can only do so much to assist and cannot do the experiment for you.
I think @MarionGaff1 already has been experimenting and reporting back ![]() - she mentioned wrangling the lights around and setting up a dark tent, and speaking from my own efforts to control lighting, that’s a lot of wrangling.
- she mentioned wrangling the lights around and setting up a dark tent, and speaking from my own efforts to control lighting, that’s a lot of wrangling.
I think the first step really is getting the light sufficiently uniform. There isn’t even any real point in trying to make a target chart shot until the light across the target chart is more or less uniform, which brings up the question of how uniform is uniform enough? less than 1 difference in L across the chart? less than 2? less than 5?
Checking the scanner for uniform capture of a solid gray chart or paper or the back of the SpyderChecker 24 also seems like a good preliminary step. Scanner lights do age, and their characteristics change even apart from streaks of uneven light (our old scanner makes long lines of bright colors here and there from burnt out lighting elements, sigh). So if the lighting is even on the scanner, scanning the target chart seems like a good thing to do - whatever profile that might have been supplied with the scanner, the scanner is no longer “the same” as it was way back when.
Is there an option with the scanner to output “raw” colors rather than having an automatic conversion to some built-in color space like sRGB or the AdobeRGB color space you mentioned? This is one characteristic (ability to output raw color) that would indicate the scanner might be a reasonably nice scanner.
@afre 's suggestion regarding sample cards seems like a really good idea as a simple visual check on the accuracy of the colors from photographing the orange peels. Earlier I was thinking Munsell book of colors pages that have orange colors, but rejected that idea because no sane librarian would let a copy of the Munsell book of colors go out the door, and if the book actually can be checked out, it’s probably old, with mangled or missing pages and possibly faded colors.
But really, for a visual check, known colors aren’t needed. All you need are colors that are visually close. Paint stores and hardware stores that sell paint are excellent sources for sample paint color strips, at least here in the US. The people in the paint department might look at you kind of funny when you bring a sample dried orange peel in and start comparing it to paint color strips, but people have brought stranger things in asking for paint that matches.
I think trying to use a filter to compensate for whatever problem would just pile on new problems.
Hmm, if the chart is printed instead of having actual pigments, then probably it doesn’t have any advantage over the SpyderCheckr 24 patch chart.
I’ve never seen an actual X-rite Color Checker chart - are the patches raised up a bit from the surrounding surface like a layer of paint?
In retrospect, this thread could have been entitled something like “Getting colorimetrically accurate colors out of a camera or scanner” - converting the captured RGB colors to XYZ and then to LAB is the easy part!
![]() Meaning to say that it might take more than 3 days to figure out, and more to conduct the actual data collection. It is a PhD after all and science at that, so hair pulling is to be expected.
Meaning to say that it might take more than 3 days to figure out, and more to conduct the actual data collection. It is a PhD after all and science at that, so hair pulling is to be expected. ![]()
That was what I meant. @MarionGaff1 (wait, why are there two @MarionGaff s?) has a colorimeter, so the actual reference doesn’t matter as long as it is close and a good enough reference.
I thought about that. Whether they are good enough is another question. What I would say is that the samples that you can pick up in the aisles vary in quality and not as good as the ones that are on display but cannot take home. Maybe the better choice would be to acquire sample paints that you could use on your preferred surface, or even mix.
Regarding checker charts, I have read that recent ones aren’t as good as the older ones in quality and consistency. They need to be double checked using a colorimeter in case you get unlucky.
It’s fundamental to camera profiling that the statistics of the samples (whether real or virtual) need to represent what’s being photographed, if the average accuracy is to be high. That’s because of the maths of approximating one colorimetric observer with a different one (a high dimensional difference) via a 3x3 matrix or similar low dimensional transform. The approximation means you have to make compromises, and the statistics of the samples determines what those compromises are.
If your test chart is fundamentally 3 (or low) dimensional itself, because it’s actually composed of (say) 3 colorants (i.e. CMY photographic dies), then you can expect an almost perfect match using a 3x3 matrix, but as soon as you test on other spectra or different illuminants (i.e. start exercising the higher dimensionality of the spectral sensitivity differences between the two observers) , you will notice much larger errors.
Serious camera profiling involves measuring the cameras spectral sensitivity curves, so that more sophisticated spectral calculations can be performed. For instance, armed with the spectral sensitivies one could create a matrix or cLUT transform based on thousands/millions of virtual spectral test patches, carefully chosen to represent the type of surfaces and illuminant conditions the camera is intended to be used in.
Wolf Faust’s charts are very good for setting up scanners to scan photographic media, because that’s what they themselves are made of.
I think that charts like the Datacolor SpyderCheckr series of targets may be alternatives, but it’s impossible to know for sure without analyzing the spectra of the patches in the charts. Even the ColorChecker has lower dimensionality than it appears to have, since the colorants used are composed from a more limited set (about 8 or 12 I think from memory).
People have made their own ColorChecker 24 patch charts by taking one to a paint store, and having them mix 24 paint colors to match. You could make many thousand similar charts this way, and the spectral accuracy should be respectable, since paint mixing systems aim for spectral matches. Ideally you’d want to batch characterize such charts though. Others have made their own custom charts using artistic and other pigments. They don’t have to be 24 patches, but anything they can be bothered setting out and measuring and making a reference file for.
Those with a specific use in mind (say Museums who are scanning artwork) will make up their own test charts, with test patches composed of the type of artistic colorants that will be found in the artwork they are scanning, so that the scanning accuracy is highest on the type of work they intend to scan.
The main limitation of using test charts seems to be the number of patches, the uniformity of the lighting conditions, and flare interference between the patches. With careful attention these factors can be minimized, but spectral sensitivity characterization bypasses all of them.
Thank you for the precise and referenced answer. That makes sense for sure
Sorry, the initial size was so big that even when compressing with Darktable it was still too big to be sent.
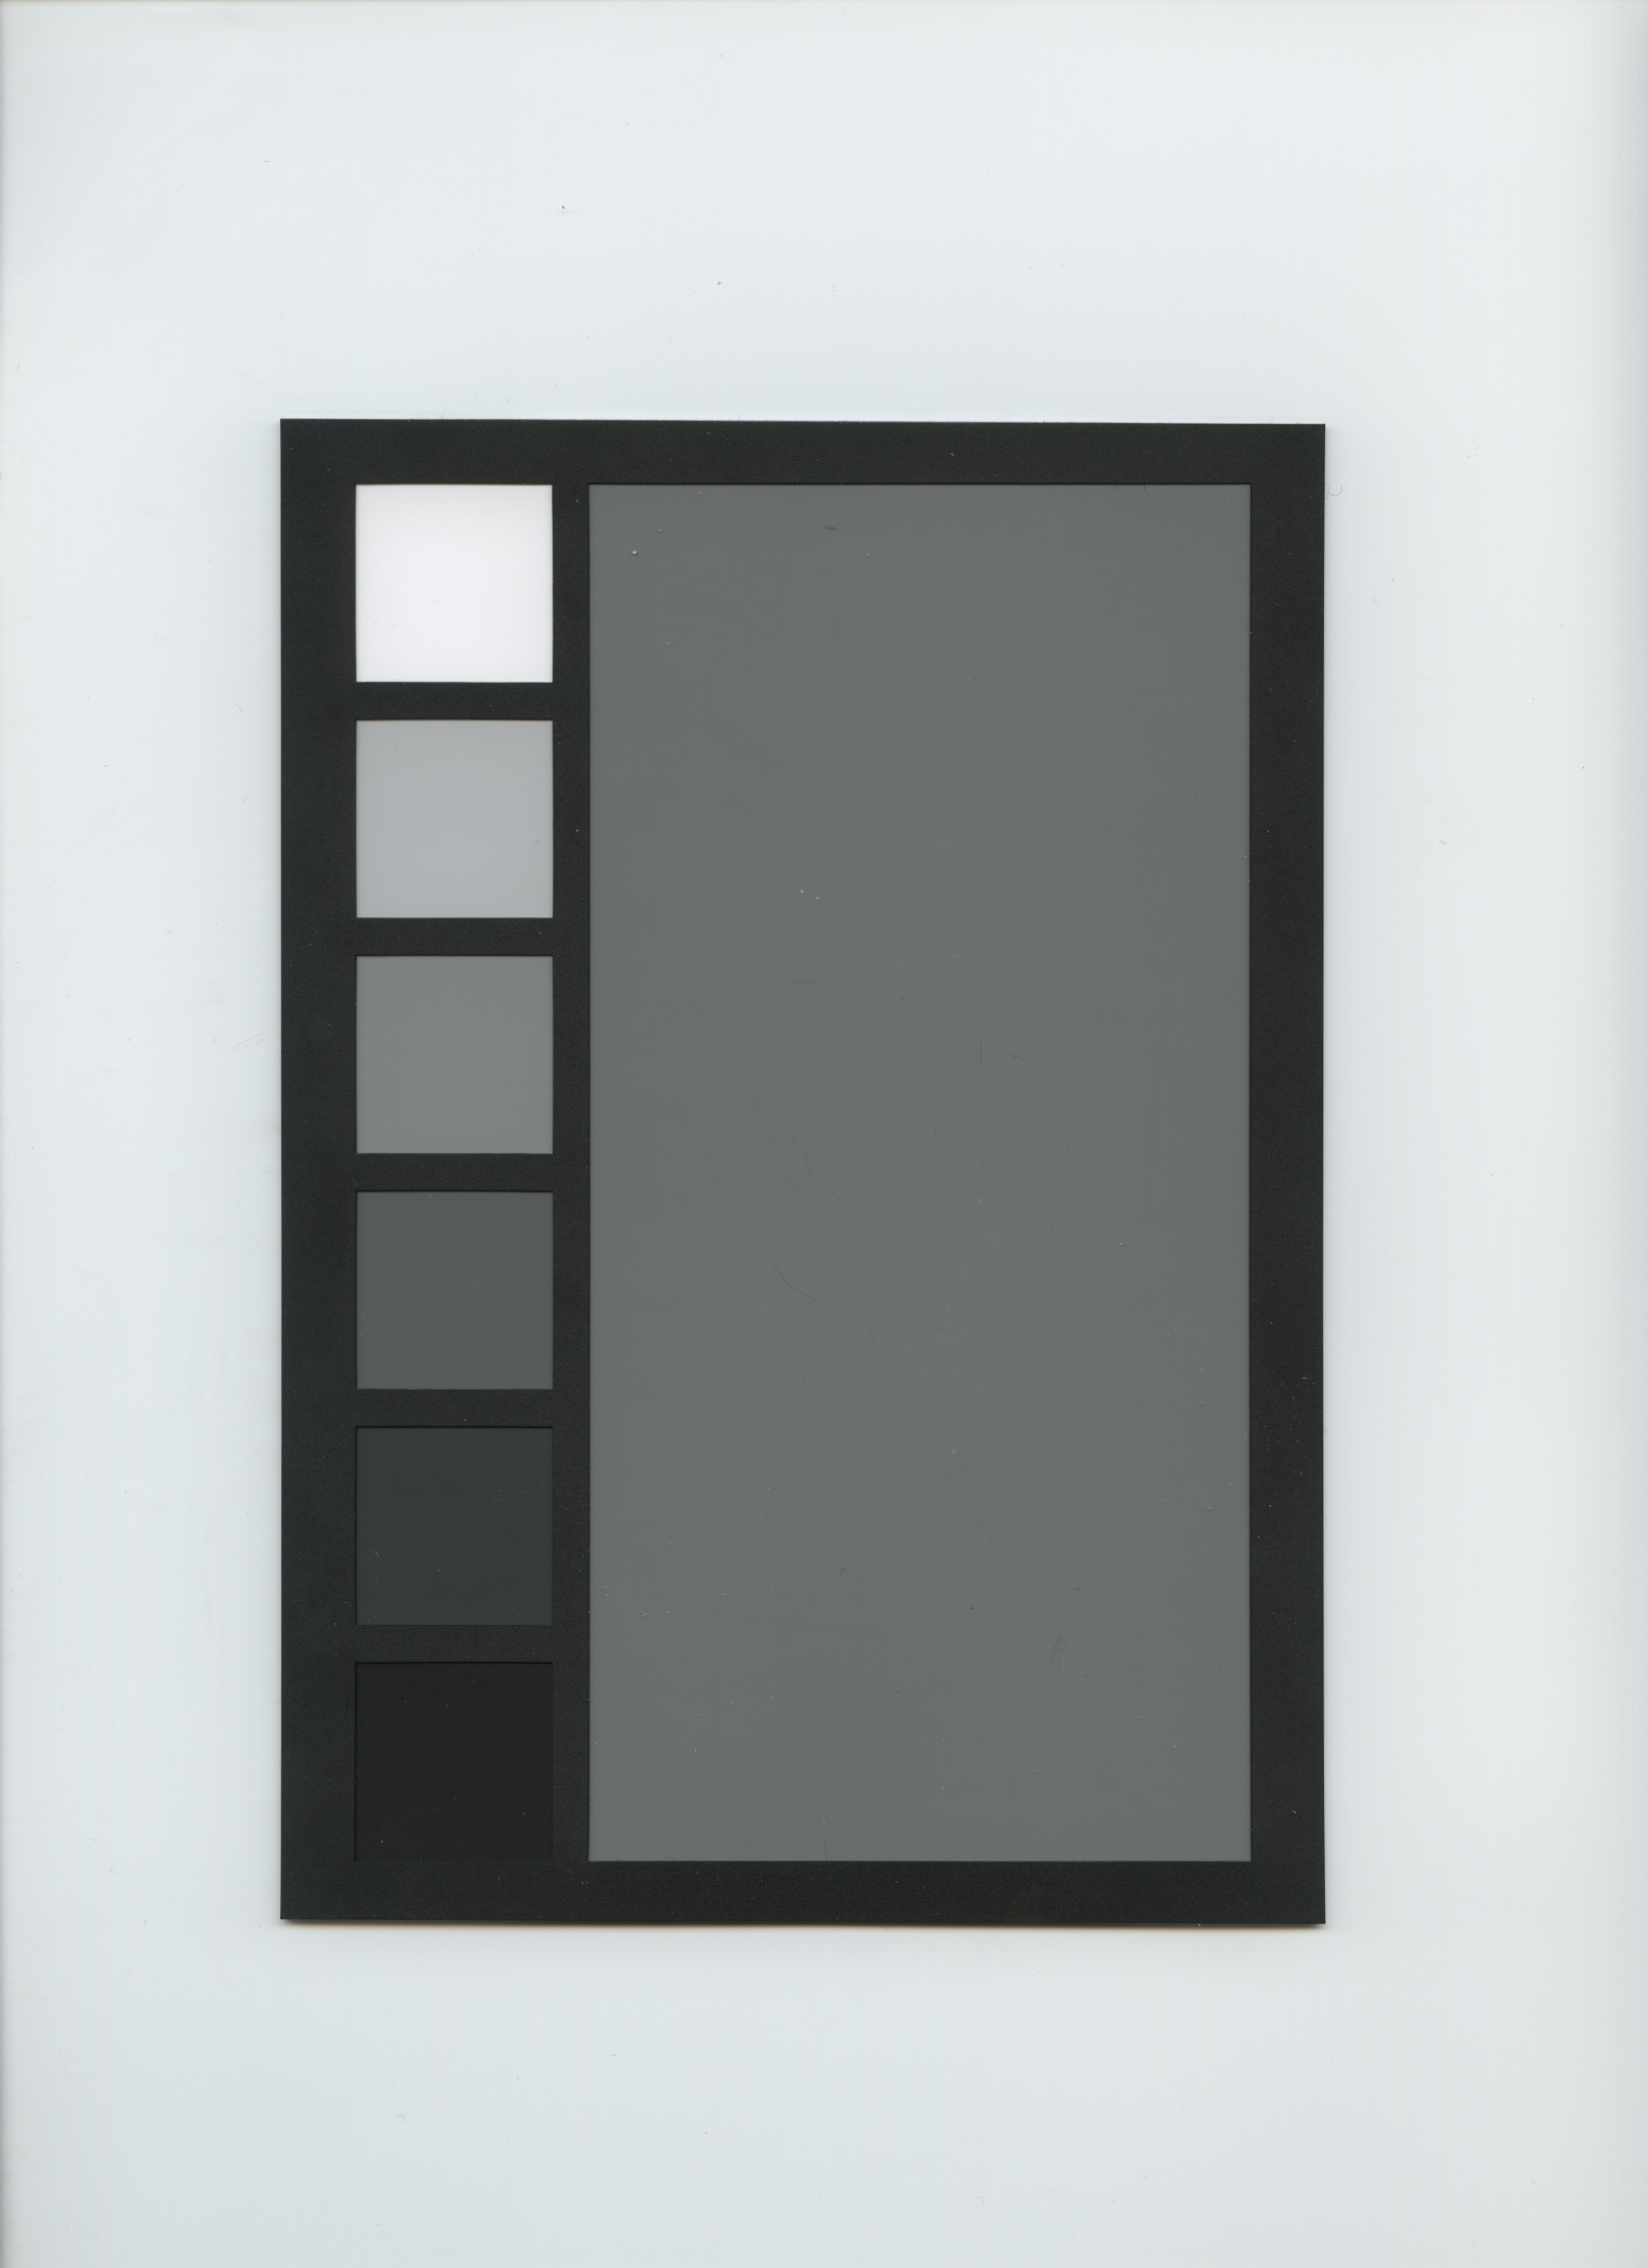
I scanned the SpyderCheckr 24 again but with only 200 dpi to be able to post it on pixls.
I register the scans in tiff format.
I have 2 more stupid questions. In the scanner settings:
I registered the gray chart with both options (ICC profile and no ICC profile) and here is what I got (only 200 dpi to be able to send them on pixls)
Target%20chart%20-%20no%20correction%20-%20200%20dpi%20-%20ICC%20profile|nullxnull
“No color correction” sounds like exactly the right choice.
Quickly checking some online reviews, it looks like the optical resolution of this scanner really is 1200dpi. But lowering the dpi to some comfortable resulting file size for purposes of initial experimentation is of course perfectly OK. Maybe when you’ve worked out a procedure think about raising the resolution again. Just don’t stray into “interpolated”, stick with “optical”.
It seems at lower resolutions scanners literally skip possible readout points: https://www.scantips.com/basics07.html.
Notice the article talks about higher resolution in one direction than the other. I don’t know if that applies to all scanners. But if your scanner is like this then I’m guessing - just guessing! I don’t have any practical experience using scanners! - that you might want to select parameters such that the readout is equal in both directions.
I don’t see an attachment - maybe there are file size limits for uploading files to pixls? In any event, an 850MB file is really big, I’d like to download and take a look at a scan of the target chart, but a smaller file size would be much kinder to my limited bandwidth. Is it possible to rescan/resize it down to something well under 100MB? Maybe down around 20MB to 40MB?
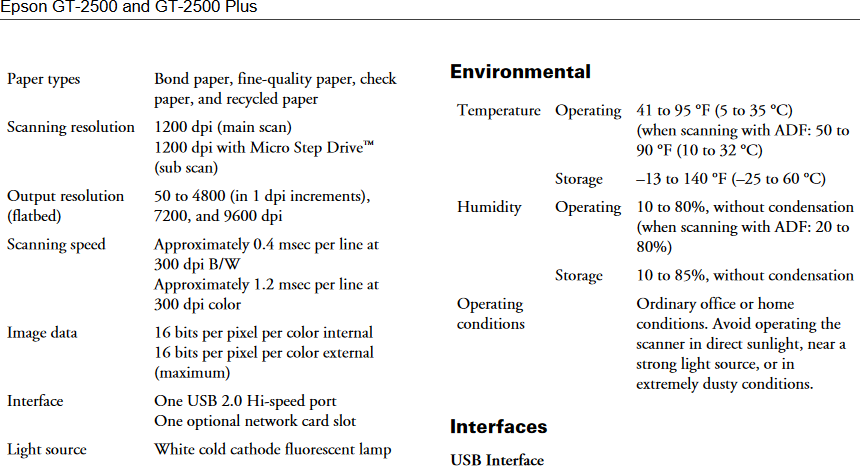
Here is a relevant section of the manual. I would use the mode that scans slower (maybe that is what Micro Step Drive is for), natively (looks like 1200 dpi) and at the highest bit depth (looks like 48 bit RGB). I might also consider the temperature of the scanner since we are dealing with organic matter. Also note the light source.
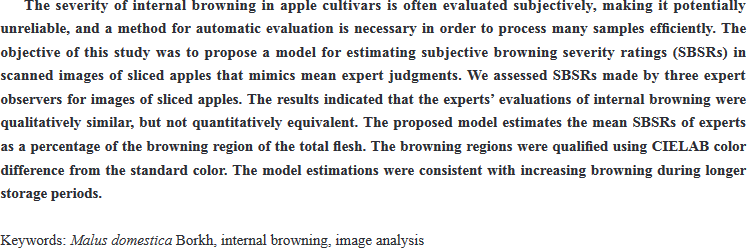
Speaking of scanning, a quick search led me to a paper that might be relevant.
3. https://www.jstage.jst.go.jp/article/fstr/23/4/23_545/_pdf
PS
If file size and processing is a challenge, don’t hesitate to use a lower resolution. I suggest that you use either half-size or quarter-size to take advantage of pixel binning (600 or 300 dpi). There are advantages to using lower resolution besides being able to process the images; such as better SNR and less influence of dust and other marks that the scanner glass or peels may have.
That does seem better than selecting a lower resolution. But then downsize the image to a manageable size, perhaps using a scaling algorithm such as GIMP’s “linear”, definitely not something like GIMP’s “Cubic” which somewhat sharpens as it downsizes.
Thank you for the precise and referenced answer. That makes sense for sure
Sorry, the initial size was so big that even when compressing with Darktable it was still too big to be sent.
I scanned the SpyderCheckr 24 again but with only 200 dpi to be able to post it on pixls.
I register the scans in tiff format.
I have 2 more stupid questions. In the scanner settings:
I registered the gray chart with both options (ICC profile and no ICC profile) and here is what I got (only 200 dpi to be able to send them on pixls)
Thank you!
I did not see the “micro step drive” option when I used the scanner, but I will look for it.
Concerning the “highest bit depth”, yes this is what I had chosen “48 bits color”
It is playing time up here in Sweden: I picked up one Nadorcott and my Colormunki Photo spectrophotometer. Using Argyll’s spotread, I measured five more or less random spots on the Nadorcott (handheld) and here is what Colormunki reported:
XYZ: 29.621478 20.013466 1.305972, D50 Lab: 51.852433 44.910105 66.767355
XYZ: 32.354465 22.585119 1.937511, D50 Lab: 54.642401 42.956591 64.520720
XYZ: 31.430769 21.333597 1.291062, D50 Lab: 53.312679 45.349696 69.476870
XYZ: 27.254337 18.020918 0.972389, D50 Lab: 49.521469 45.719796 67.450873
XYZ: 32.618553 22.894400 1.436598, D50 Lab: 54.963400 42.515748 70.509651
Have fun!
Claes en Lund, La Suède
I had a look to the paper you sent and there are indeed some interesting points for the setting of the scanner:
“Each fruit was sliced at the equator at a thickness of 1 cm, and the slice was captured by a flatbed image scanner (GT-X980, Seiko Epson Corp., Suwa, Nagano, Japan). The flatbed scanner is readily available and allows the easy acquisition of highly stable samples because its shooting environment (i.e., the configuration of light source, camera and scanning surface) is fixed within the same product. The cover of the scanner (the transparency unit) was removed to accommodate the fruit; thus, in order to eliminate external lighting, the fruit was covered by a black Bakelite board during scanning. The scanning resolution was 1200 dpi and the color depth was 16 bits per R/G/B component.”
I had planned to cover the peels with blue paper (the same background I used to take photos with the camera), cover the blue paper with a black cloth and then press with the usual cover of the scanner.
1. Byte sequence should not matter since you are saving to a TIF, which is a standard format.
2. If the ICC profile isn’t integrated, it means that the data is in the scanner’s native colour space and you can make a custom profile of the scanner. (It is possible that the scanner firmware or app converts the colour space internally but then why would we have the option of not including the ICC profile?)
One thing I would add to the dpi vs bit depth business is that I would rather scan at lower dpi with the native (max) bit depth since colour integrity and gradients are more important to you. Ideally, you would scan at 1200 dpi and 48 bits, then down sample the resolution using a batch script.