I don’t want to derail this thread, so I’ll just mention that the v7 command is “magick”, rather than “convert” or “composite”.
The IM forum https://www.imagemagick.org/discourse-server/index.php is a good place to ask questions specific to IM.
I don’t want to derail this thread, so I’ll just mention that the v7 command is “magick”, rather than “convert” or “composite”.
The IM forum https://www.imagemagick.org/discourse-server/index.php is a good place to ask questions specific to IM.
@MarionGaff1 - here are example commands for making a profile for your Epson scanner, along with some comments about the scanner and the target chart:
When making a scanner input profile, the first step is to create a “ti3” file (http://argyllcms.com/doc/File_Formats.html#.ti3). The ti3 file contains information read from the target chart. Creating the ti3 file requires three different files:
A scan of the target chart. In the example commands below the file name for the target chart scan is “epson-gt2500-spyderchecker24.tif”.
A “cht” file that specifies the locations of the various patches of the target chart. This file is supplied by ArgyllCMS. It’s in the “ref” folder. The “cht” file for the SpyderCheckr24 is “SpyderChecker24.cht”.
A reference file for the target chart that supplies the CIEXYZ values for each patch. There is a reference file for the SpyderChecker24 in the ArgyllCMS “ref” folder, with the file name “SpyderChecker24.cie”.
You can open the “.cie” reference file with a text editor and see that the create date is Dec 19, 2011. The CIEXYZ values might or may not be accurate enough for your specific SpyderChecker24 target chart. You could measure the values yourself, or download similar information from the datacolor website, or perhaps you were already given such a file along with your SpyderCheckr24 target chart. Hopefully your target chart isn’t too old and has been stored in such a way as to minimize color changes, which do happen over time.
There is a bit of information in the “cie” reference file that says it’s for D65 light. I don’t know what difference this bit of information might make. I’ve only ever made and used an IT8 camera target chart, for which I used a reference file for D50 light, and did my best to make the target chart shot under roughly D50 lighting.
To create the ti3 file - that will then be used to create the actual scanner profile - put all three files in the same folder. Then at the terminal cd to the folder and type the following commands, modified of course to reflect whatever file name you’ve given the target chart shot:
scanin -v -dipn epson-gt2500-spyderchecker24.tif SpyderChecker24.cht SpyderChecker24.cie
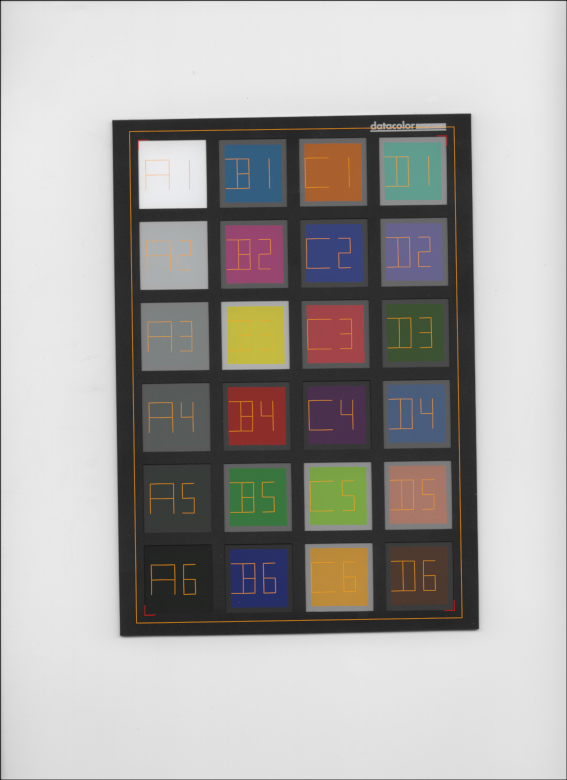
The “-v” switch just says “spew out a lot of information about what’s being done”. The “-dipn” switch says “also output a little diagnostic image that shows where scanin located the various patches”. The resulting file “diag.tif” is useful to make sure scanin actually did correctly locate all the color patches on the target chart, and also shows which color patch goes with which patch ID in the reference file.
Here’s what the “diag.tif” looks like (this is a reduced-size jpeg):
The next step is to use the “colprof” utility along with the ti3 file to make the actual ICC profile. ArgyllCMS can be used to make several different types of ICC profiles, including XYZ LUT, LAB LUT, and shaper matrix profiles, with many possible variations on each type of profile controlled by using various switches including the “-q”, “-a”, “-r”, “-u”, and “-ua” switches. The colprof documentation explains each type of profile and what all the various switches do: http://argyllcms.com/doc/colprof.html
If I were making a “general purpose, use the scanner like a camera” profile for the Epson scanner using the SpyderCheckr24 target chart, this is the command with the specific parameters that I’d use - notice you don’t type “.ti3” after the base file name for the previously generated ti3 file:
colprof -v -qm -al -r0.5 -u -D"epson-gt2500-spyderchecker24-qm-al-r050-u" -O"epson-gt2500-spyderchecker24-qm-al-r050-u.icc" epson-gt2500-spyderchecker24
Which writes out an ICC profile with the file name “epson-gt2500-spyderchecker24-qm-al-r050-u.icc” and also prints out some interesting information to the terminal, including a summary error report.
The -qm, -al, and -r0.5 options are actually what the colprof command does by default, and ask for a medium quality LAB LUT profile, using 0.5% as the average deviation for the “device+instrument readings”.
The “-D” option allows you to put any description you want into the description field in the ICC profile and the “-O” option let’s you specify the ICC profile file name. When making a series of ICC profiles it’s nice to use these fields to keep track of things like “which device, which target chart, shot/scanned under which conditions (eg using or not using a blue or black background), using which ti3 file, and which switches, etc”. I always make the “-D” and “-O” strings match because a lot of software doesn’t show you the file name for ICC profiles, instead only shows you the description field, when you are trying to see what profile is actually embedded in an image.
The “-v” switch asks colprof to print extra information including a summary error report.
According to the terminal output, for the resulting ICC profile, “peak err = 1.953983, avg err = 0.557773”. Whether this peak and average error is sufficient is not something I can really comment on. But it’s worth using a couple of other ArgyllCMS tools to investigate a bit further, starting with “profcheck” (http://argyllcms.com/doc/profcheck.html) which can output a complete report on the error for each patch, using several different ways to calculate the error. Here’s how to get the default error calculation for each patch:
profcheck -v2 epson-gt2500-spyderchecker24.ti3 epson-gt2500-spyderchecker24-qm-al-r050-u.icc
The patch with the highest error is B1, which is a blue patch. For C1 - the “orange color” patch, the error is 0.606490. The other ways of calculating the error provided by profcheck are worth investigating. Also, I didn’t check, but for other types of profiles, I’m guessing that which patch has the highest error will vary depending on the profile type that you choose to make.
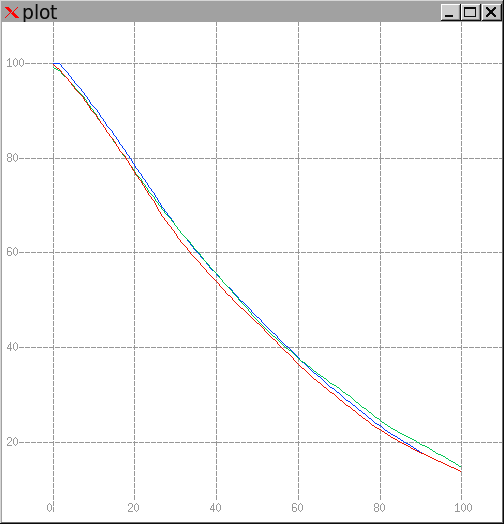
You can get arbitrarily small errors for the colors in the target chart by asking for a higher quality ICC profile (-qh or even -qu) with increasingly smaller “-r” values. Unless you actually have an independent measure of the errors in the target chart, all that using a small value for “-r” accomplishes is curve-fitting to the target chart patches. If you assume a smooth variation in device response then the ArgyllCMS “xicclu” utility can provide a visual guestimate of “curve fitting” (xicclu):
xicclu -ir -fif -g epson-gt2500-spyderchecker24-qm-al-r050-u.icc
which produces this, which to me looks believably smooth for an RGB device:
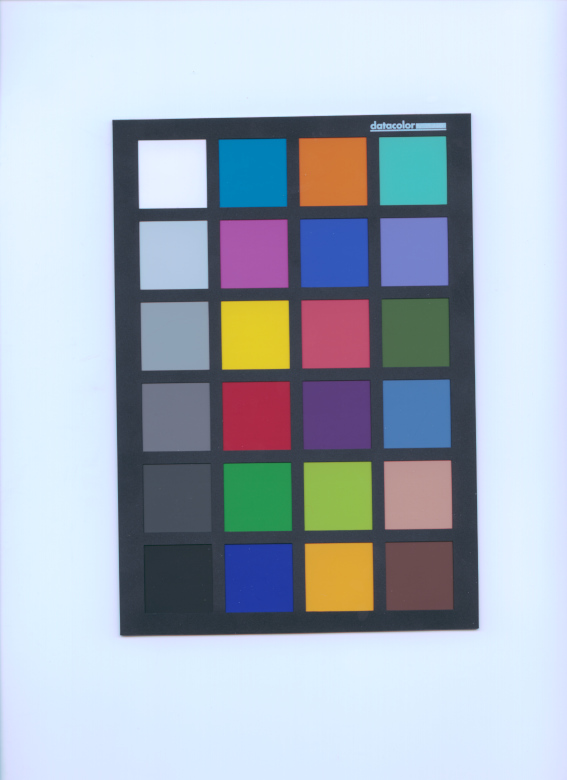
Here’s what the scanned target chart looks like when first opened in GIMP, before assigning the newly made scanner profile - as the image doesn’t have an embedded ICC profile GIMP assigns GIMP’s built-in sRGB profile:
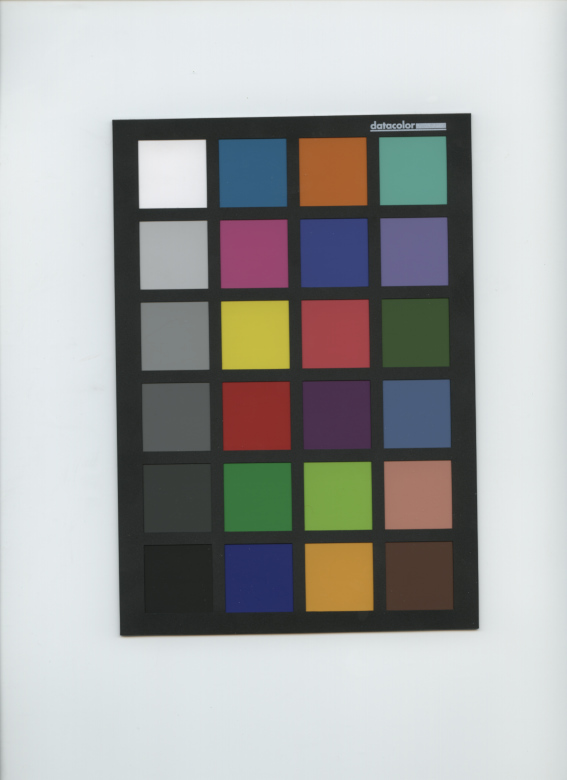
Here’s what the scanned target chart looks like after assigning the newly-made scanner profile:

Assigning the profile makes the colors a little brighter. But it seems to me that the scanned target chart has already had some sort of TRC modification done before the “raw” RGB values were saved to disk during the scanning process. In other words, this doesn’t look like an actual raw scan, some sort of preprocessing seems to have been done by the scanner.
Switching topics, there really aren’t enough sample points in the target chart to justify making a LUT profile. But when I made a shaper matrix profile the max and average errors were higher:
colprof -v -qm -as -r0.5 -u -D"epson-gt2500-spyderchecker24-qm-as-r050-u" -O"epson-gt2500-spyderchecker24-qm-as-r050-u.icc" epson-gt2500-spyderchecker24
peak err = 11.608028, avg err = 3.449169
and the resulting “xicclu” graph was very “squiggly” in a way that one wouldn’t expect a linear device to be - I’m assuming scanners are inherently linear devices but maybe I’m wrong:
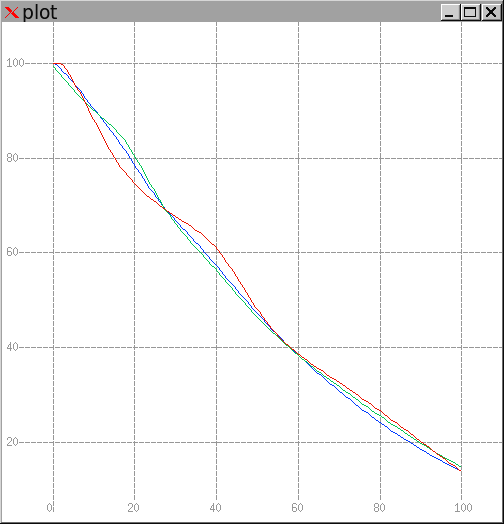
FWIW, a truly linear device such as many cameras when shooting raw has a much more deeply downward-curved xicclu graph. A straight line xicclu graph would mean the device itself has a perceptually uniform responses to light.
The ArgyllCMS documentation (Argyll Usage Scenarios) says this:
If the purpose of the input profile is to use it as a substitute for a colorimeter, then the -ua flag should be used to force Absolute Colorimetric intent, and avoid clipping colors above the test chart white point. Unless the shaper/matrix type profile is a very good fit, it is probably advisable to use a LUT type profile in this situation. . . .
For the purposes of a poor mans colorimeter, the following would generally be used: colprof -v -D"Scanner A" -qm -ax -ua scanner
I don’t have a clue what’s involved with using a scanner as a colorimeter, but here’s the command rewritten to include descriptions and such:
colprof -v -qm -ax -r0.5 -ua -D"epson-gt2500-spyderchecker24-qm-ax-r050-ua" -O"epson-gt2500-spyderchecker24-qm-ax-r050-ua.icc" epson-gt2500-spyderchecker24
which reports peak err = 7.720558, avg err = 2.309703.
Here’s the xicclu graph, which to me looks very odd:

And here’s what the target chart looks like when this “colorimeter” profile is applied:
Disregard the advice about creating a cLUT profile for using a scanner as a “poor man’s” colorimeter - it is given on the assumption that a reasonable sized test chart was being used, i.e. a ColorChecker DC or a custom chart with a lot more patches. If you have a 24 patch ColorChecker, then stick to shaper/matrix.
Hi all!
Thanks a lot to you all for your precious help! I am struggling experiments and reports. Sorry, I did not answer before.
I had hoped I would have time to go deeply into Image Magic earlier, but it appears that my “free-time” is now preciously kept to have a bit of sleep!
@Elle You did an impressive work and very detailed and precise instruction manual. I am deeply thankful.
Fingers crossed, I should have time to go back to colorimetry next week, and will get back to you! 