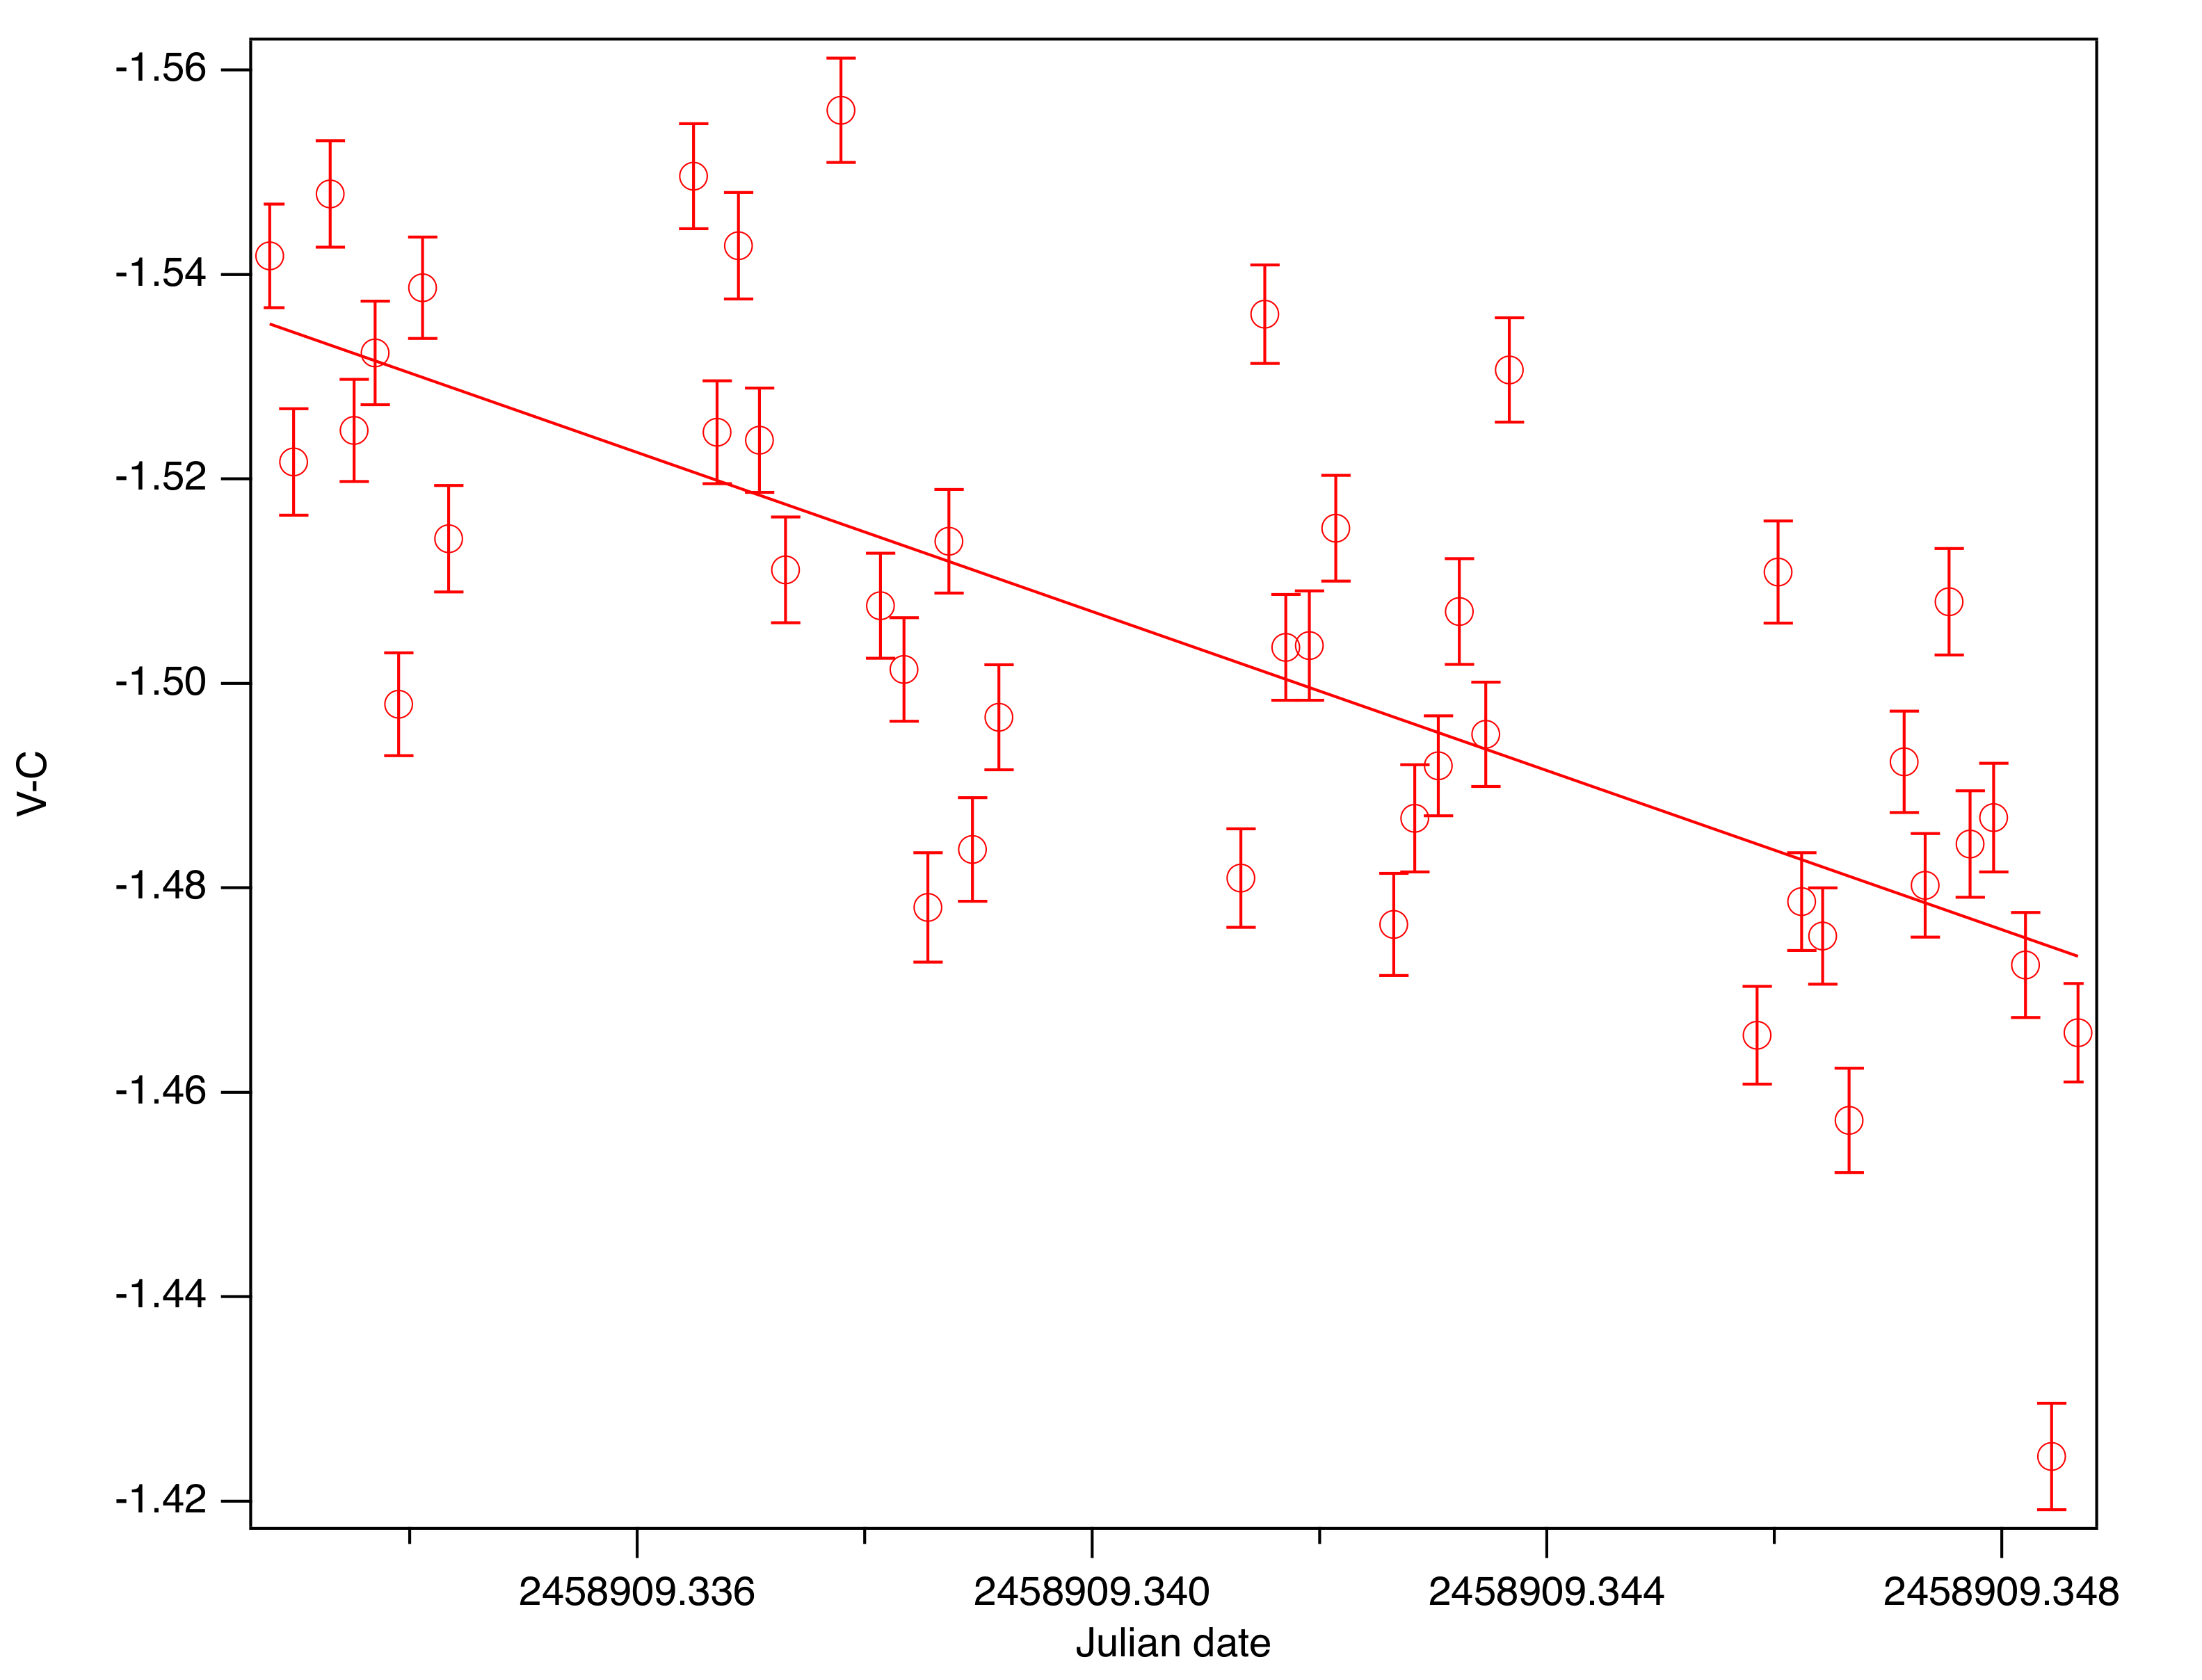
Here a better analysis.
The curve is nice :).

You did this analysis with OSA, right? I’ll try it tomorrow.
You see, I’m somewhat obsessed with the GSA method for the reasons mentioned in my last post.
GSA with “Translation only” could be used for photometry. This won’t work, if images have rotation (and images with 35mm lens have rotation). I think I got this.
GSA without “Translation only” computes translation and rotation angles for each image. This is easy and works perfect but is not ok for photometry.
Maybe I’m imagining things too simply: Why not define a layer of measurement circles (V, 1, 2, 3, 4, 5, 6 and perhaps even more) on the reference image and translate and rotate this layer according to the results of GSA (without “Translation Only”) and apply these rotated layers to the non-rotated images? Then, the non-rotated images are used for photometry (which is fine) and the measurement circles should match with the stars we want to measure.
I’m not sure to understand. Sorry.
But OSA is so easy to use. Produce no new images and almost never fails :).
In photometry we want to avoid to apply rotation in order to avoid interpolation that could modify raw signal.
Ok, it’s late in the evening  Will have a look at OSA tomorrow.
My last words before I have to take a nap:
GSA without “Translation only”: layer of measurement circles (V, 1, 2, …) is fixed and the images are rotated in such a way that all stars match >> Works perfect, good for stacking, but bad for photometry, agreed!
My idea: Why not keep the images unrotated, but rotate (and translate) the layer of measurement circles (GSA without “Translation Only” makes all necessary calculations of translation and rotation already now!) >> Good for photometry since all images are not rotated.
That may be a good idea @nunki. For now the rotation parameters are not saved anywhere, they are just used to rotate images, after which we use the new sequence of rotated images. But we have planned to keep the rotation parameters for Bayer drizzle implementation, so maybe we’ll be able to do what you say as well once this is done (not before April).
NIce to see somebody doing photometry!
@lock042 : do you have a problem with your free-astro.org email address?
1 Like
Was not aware about that.
That sounds promising! Looking forward to the next releases 
Maybe the other two things from my first post (more comparison stars and measurements of same stars on R, G, B without picking the same stars again) are also worth thinking about
One last question:
The magnitude differences of two stars slightly differ depending on the display mode the images are shown (autostretch, histogram,…). It’s not that much (third decimal place in my test), but is there a display mode you recommend for photometry?
Display mode should not change anything.
I thought so too, but it does.
In my series I measured Betelgeuse and gamma Ori and exported the magnitudes as csv, then in libreoffice I calculated the difference between the two values and the mean of all differences of the series.
I did this for “autostretch” and “histogram”. The means of autostretch and histogram differ slightly (the individual magnitudes are not equal either). I did the whole thing for R and G. In G the means differ from the third decimal place on, in R from the fourth.
It is really impossible since pixels used for computation are not the same than those displayed on screen.
So the difference comes from something else.
Nothing is impossible ![]()
Oh, the bug could exist, but not because of it ![]()
Pretty sure the difference comes from Siril, to be honest.
I did the calculation yesterday for G, today for R and always got this small deviation. The individual magnitudes (exported via csv) should be also the same for “autostretch” and “histogram” and all other display modes, right? Here, I also get a deviation of the means of these individual magnitudes right from the csv-file.
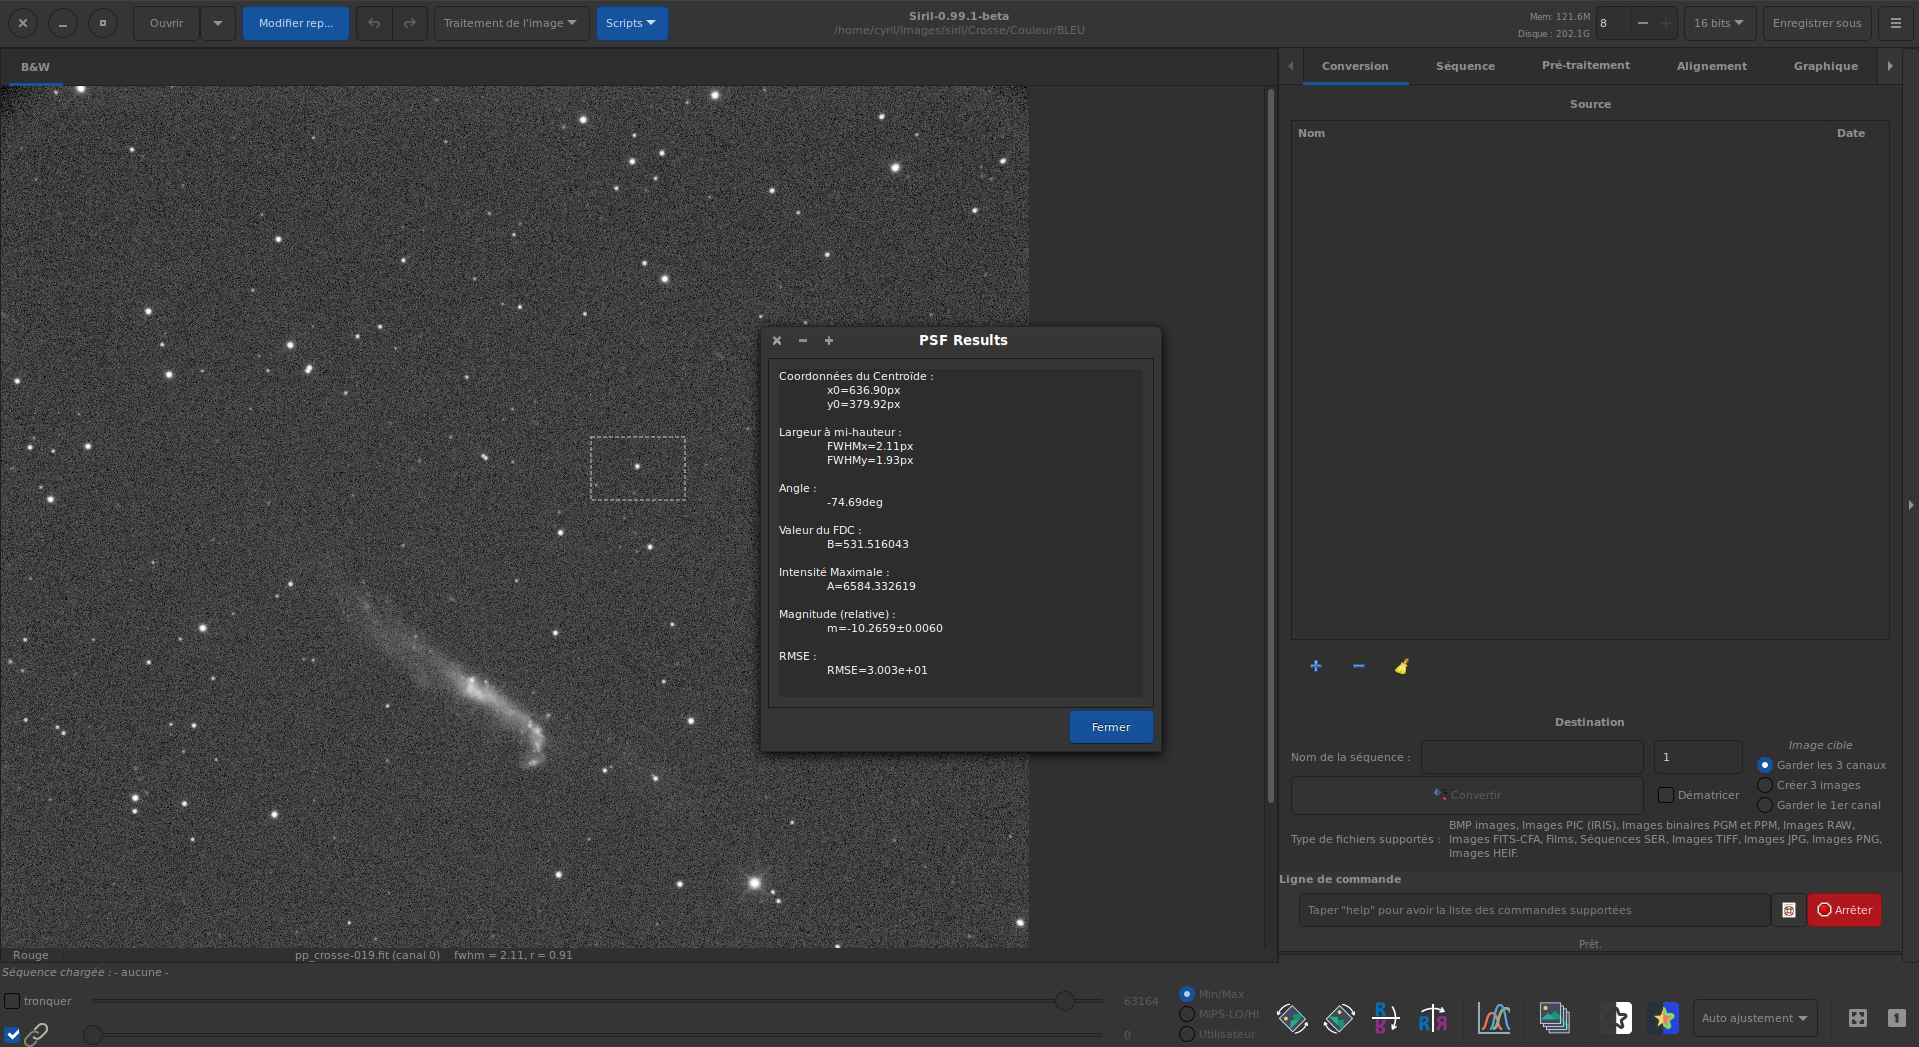
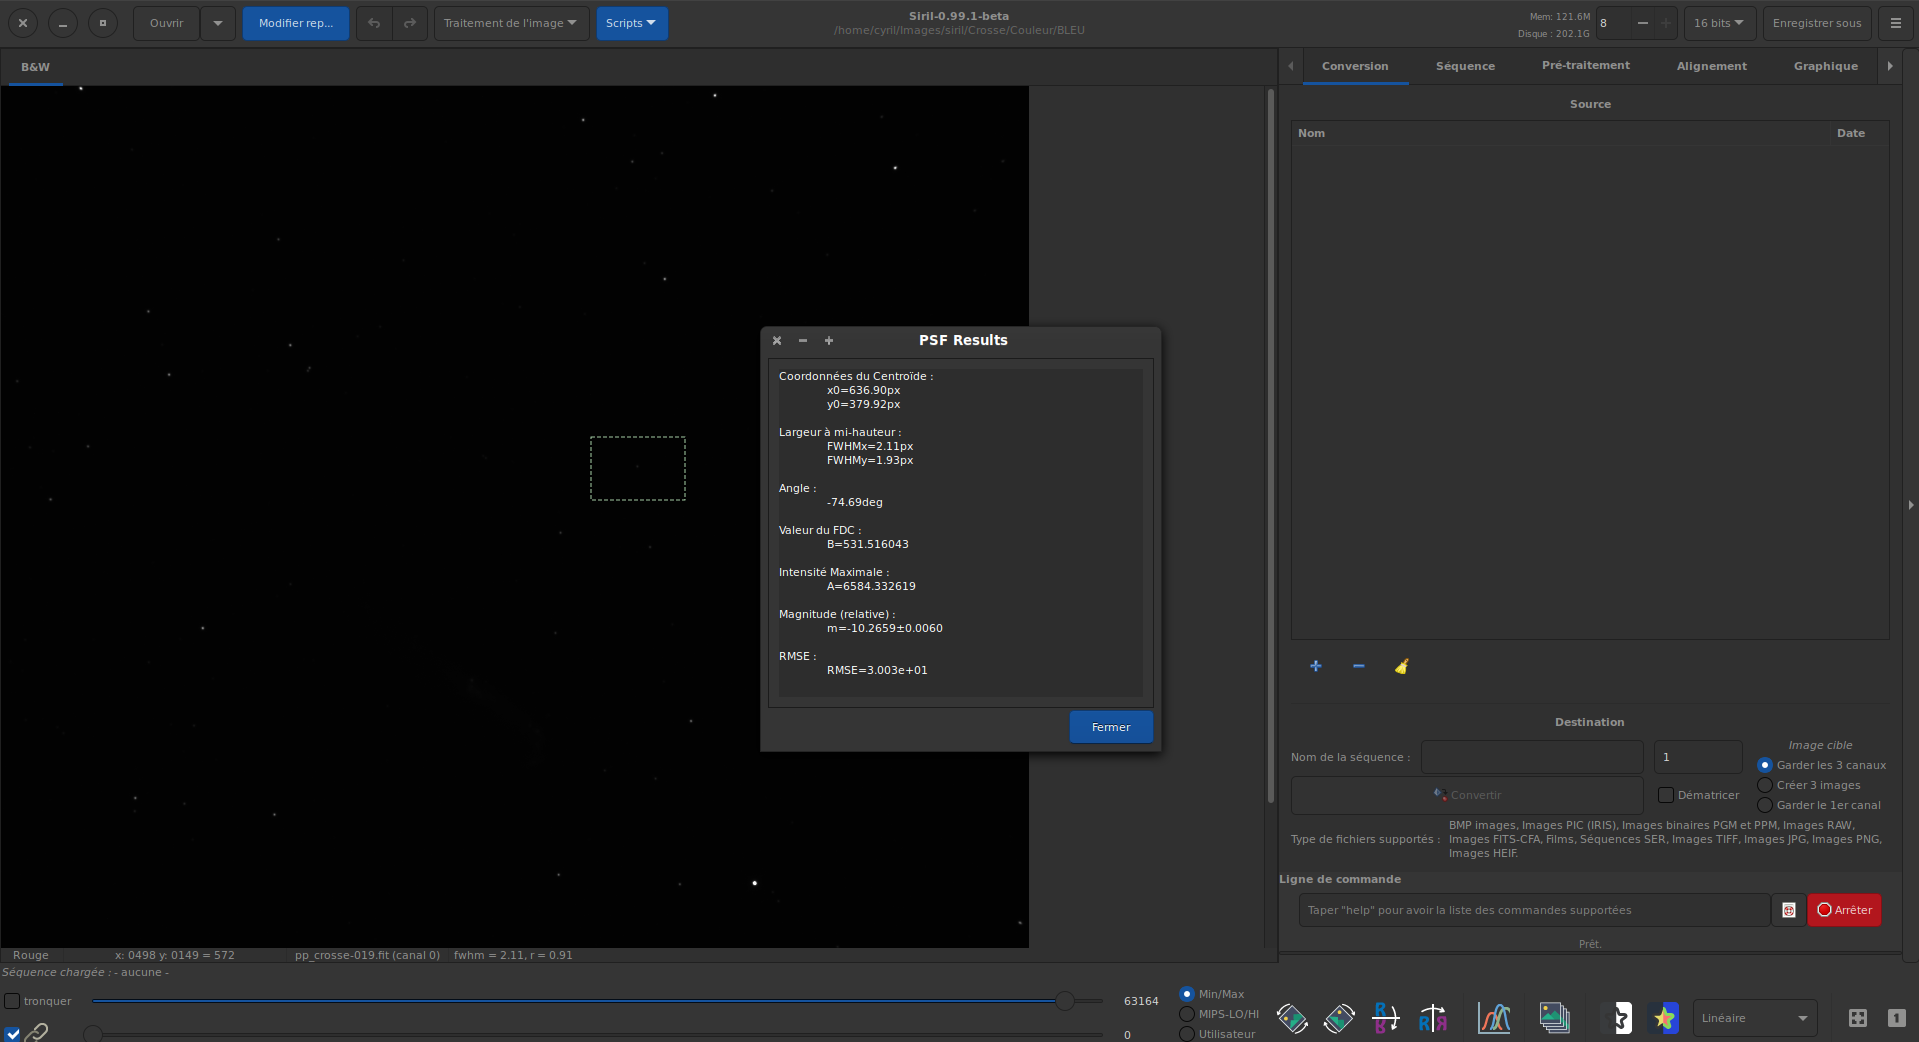

Here the result of 3 times same computation with different display modes. Of course, values are strictly identical.
EDIT: of course, if you make a selection slightly different between your test that could change the result by a tiny amount.
Well, I used the series you downloaded and used OSA with Betelgeuse. Then picked Betelgeuse and used “PSF for the sequence”. The same for gamma Ori. I think that’s the standard procedure for obtaining lightcurves.
Are there any settings that can be wrong?
Thanks, for your images. You used a B&W image. I have R, G, B layers.
Ok, I did OSA and measurements with “autostretch”, then started Siril again and switched to “histogram” for OSA and measurements. That’s where selections could change a bit, right?
You changed the selection?
Here on your betelgeuse images.
Plot with autostretch and in linear mode. Again, no diff.
Plot_as.csv (983 Bytes)
Plot_as.csv (983 Bytes)
I did an selection around the star and used “Pick a star” and then “PSF for the sequence”.
Yes, this initial selection probably changes for “autostretch” and “histogram” as I close Siril and open it again. I thought it’s just important, that this selection covers the star I’m interested in and exact size and position don’t matter.
Yes ok, so if selection changes, value changes. But by a little, this is in error stick of course. So don’t worry about that.
1 Like