As far as I can see for E-6 there is hardly any signal from the scene in IR. So I normalized the IR to the average level, put a threshold to avoid introducing noise and then divided every channel by this modified IR-image. No smoothing applied here. That was the example above.
Smoothing was applied by my imageJ macro in preparation for the application of iSRD in SilverFast only. It was meant to slightly enlarge the defects to avoid halos around the defects if iSRD is applied with a minimum detection setting.
Hi, would you perhaps be able to share here a complete original image which demonstrates the correlated IR channel problem? Ideally with some scratches too.
I’m not sure I understand the point of dividing the channels by the normalised IR image.
Can you elaborate a bit? how does it work? the result of the division is the final clean image?
Back to my films: maybe they were not all E6, I’m not sure: I’m working right now on slides from my parents, but I remember mixing them up as kid so some rolls could even be Kodachrome! The film is now many km away from me and I cannot check. So you may be right and I’m actually working on a script which will be good for Kodachrome.
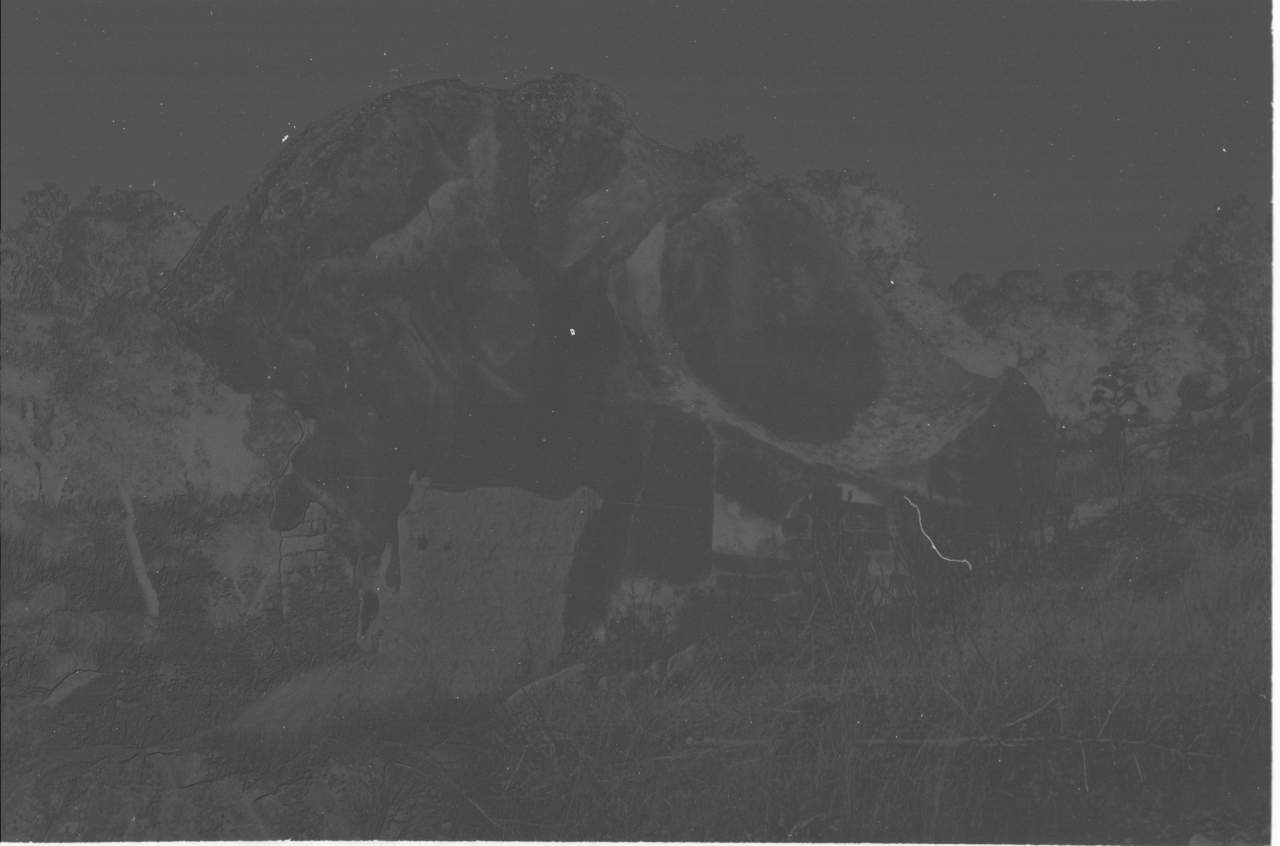
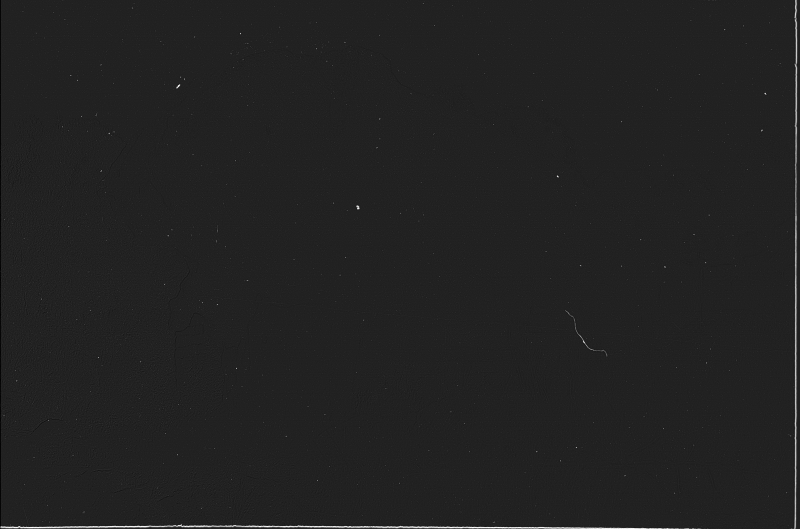
See an example of what I have also on rolls which I know for sure are E6:
It’s 250 MB…
I could crop it of course, but I think it would not be the same.
I think that the IR image posted earlier is enough to understand.
Anyone interested in replicating likely would have some on their own.
I’m not sure if much can be gained by attempting to remove the image contribution to the IR, since as you say it’s a non-linear combination. One approach is to focus only on improving the separation of scratches within the IR layer. I suggest three things for that:
subtract/divide a locally smoothed copy (median, bilateral etc.)
threshold the scratches you want removed by area
threshold the final by value
By that point anything included which is not a scratch would cause imperceptible changes with inpainting anyway.
Edit: a simple exponent (“gamma”) on the negative IR can reveal the scratches well to the eye, so I think there’s enough separation to work with.
I don’t remember whether I mentioned it already or not, but anyway: my goal by removing the contribution of the visible image is to obtain a cleaner IR histogram which I can more easily threshold to isolate dust (black spots) and scratches (white streaks) from background. The first experiments I did with GIMP showed that it was often difficult to get all the dust without ending up selecting some parts of the image data bleeded into the IR image.
It shows how wide the histogram is if left as-is.
So my goal is not to completely clean it, I only need to increase signal/noise for a simpler threshold detection. Keep in mind that I don’t want to do it one by one manually… I am ready to visually check dust/scratches masks before inpainting, sure, but manual tuning should be kept to a minimum.
The subtraction of a smoothed copy is an idea already proposed, I just haven’t tested it yet.
Threshold by area? what do you mean? manually? I don’t want to
Can you elaborate about the “gamma” test you mentioned?
Also, for info: https://www.hpl.hp.com/techreports/2007/HPL-2007-20.pdf (which was already posted earlier). Given my point clouds I could use the data for interpolation, cutting out the leftmost, non-linear part of the curve. This way I would end up with a very linear correlation, easily removable. It will overestimate contribution in dark areas, but I think that is not an issue.
My assumption is, that the attenuation (in percent) for each pixel affected by dust/scratch is the same in IR as in the RGB-channels. Thus dividing by a normalized IR-image will remove the dust/scratch in the RGB image.
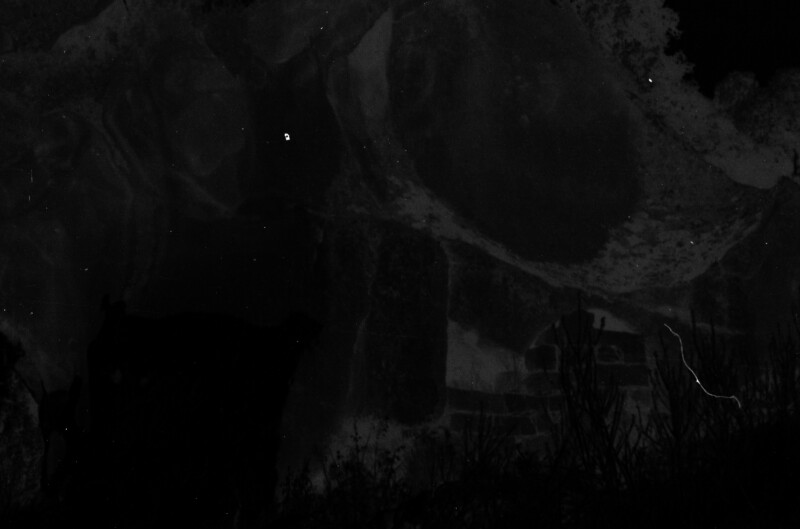
Thanks for the links, it looks interesting and I’ll need to do some reading. The quick gamma check I did in gmic is: gmic Dia_10.tif k. n 0,255 negate apply_gamma 0.45
And here is a reduced crop of the output (I’m assuming you don’t mind me displaying it here):
The article about decorrelation says:
“The algorithm therefore assumes that in the density domain the contribution of the image forming dyes on the film to IR response is linear”
It looks as though your IR is quite correlated to the red channel by matching geometric mean:
I cheated using some of my own filters in g’mic plus another to set geometric mean: gmic Dia_10.tif k[0,-1] channels.. 0 set_mean 0.5 gcd_fmean_local 3,2 sub n 0,1 pow 3
set_mean : skip ${1=0.5},${2=0}
  if $2==-1
    m "_func : pow -1 sub 1" m "_finv : add 1 pow -1"
  elif $2==0
    m "_func : log" m "_finv : exp"
  elif $2==1
    m "_func : skip 0" m "_finv : skip 0"
  elif $2==2
    m "_func : sqr" m "_finv : sqrt"
  fi
  repeat $! l[$>]
    m={[im,iM]} n 0.002,0.998 ($1) _func *.. {i/ia#0} rm. _finv n $m
  endl done
  uncommand _func,_finv
No problem, there’s still a lot of work for you to do but it’s a start
Describing the above technique in words (with IR and red channel images):
Set both images geometric mean = 0.5
Square the values of each image
Divide each image by a gaussian filtered copy (small radius, may need to add an epsilon to avoid div by zero)
Square root values of each image
Subtract them (image difference)
For viewing only: normalize and apply exponent (a threshold won’t care about that anyway)
Explanation about the squaring: it makes it ~quadratic mean, but the ideal I think would be patch maximum, so you could use exp and log rather than sqr and sqrt, just be careful with value ranges…
@garagecoder Just one little thing of note. Don’t use m,n as variable names. It would be easier to understand if they weren’t already names for command. That’s why in my G’MIC script, I avoid doing that.
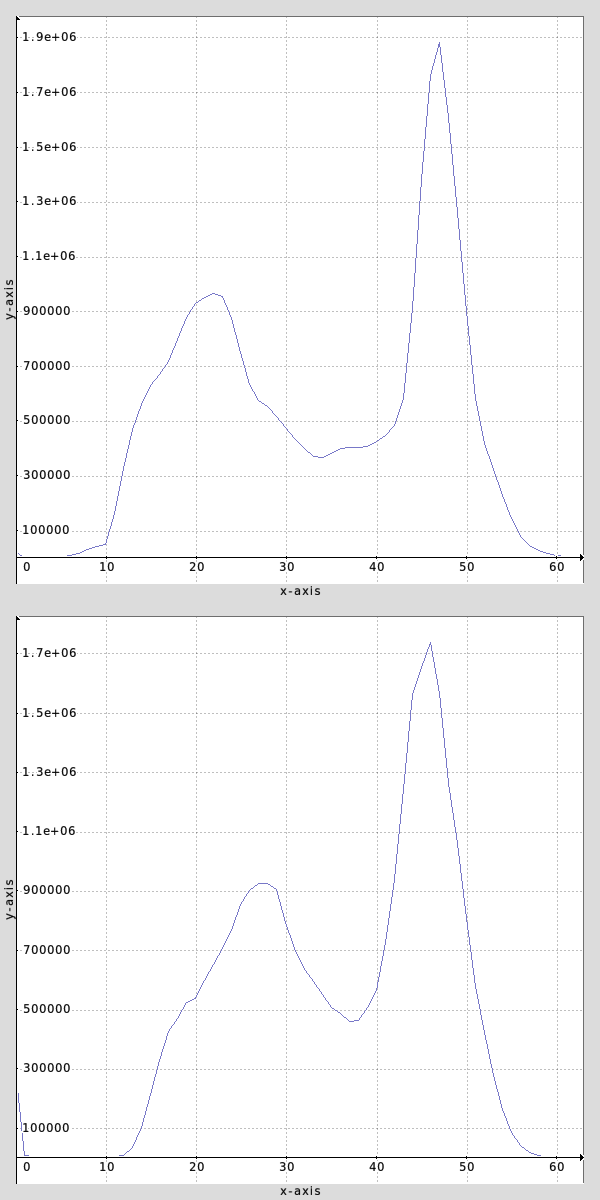
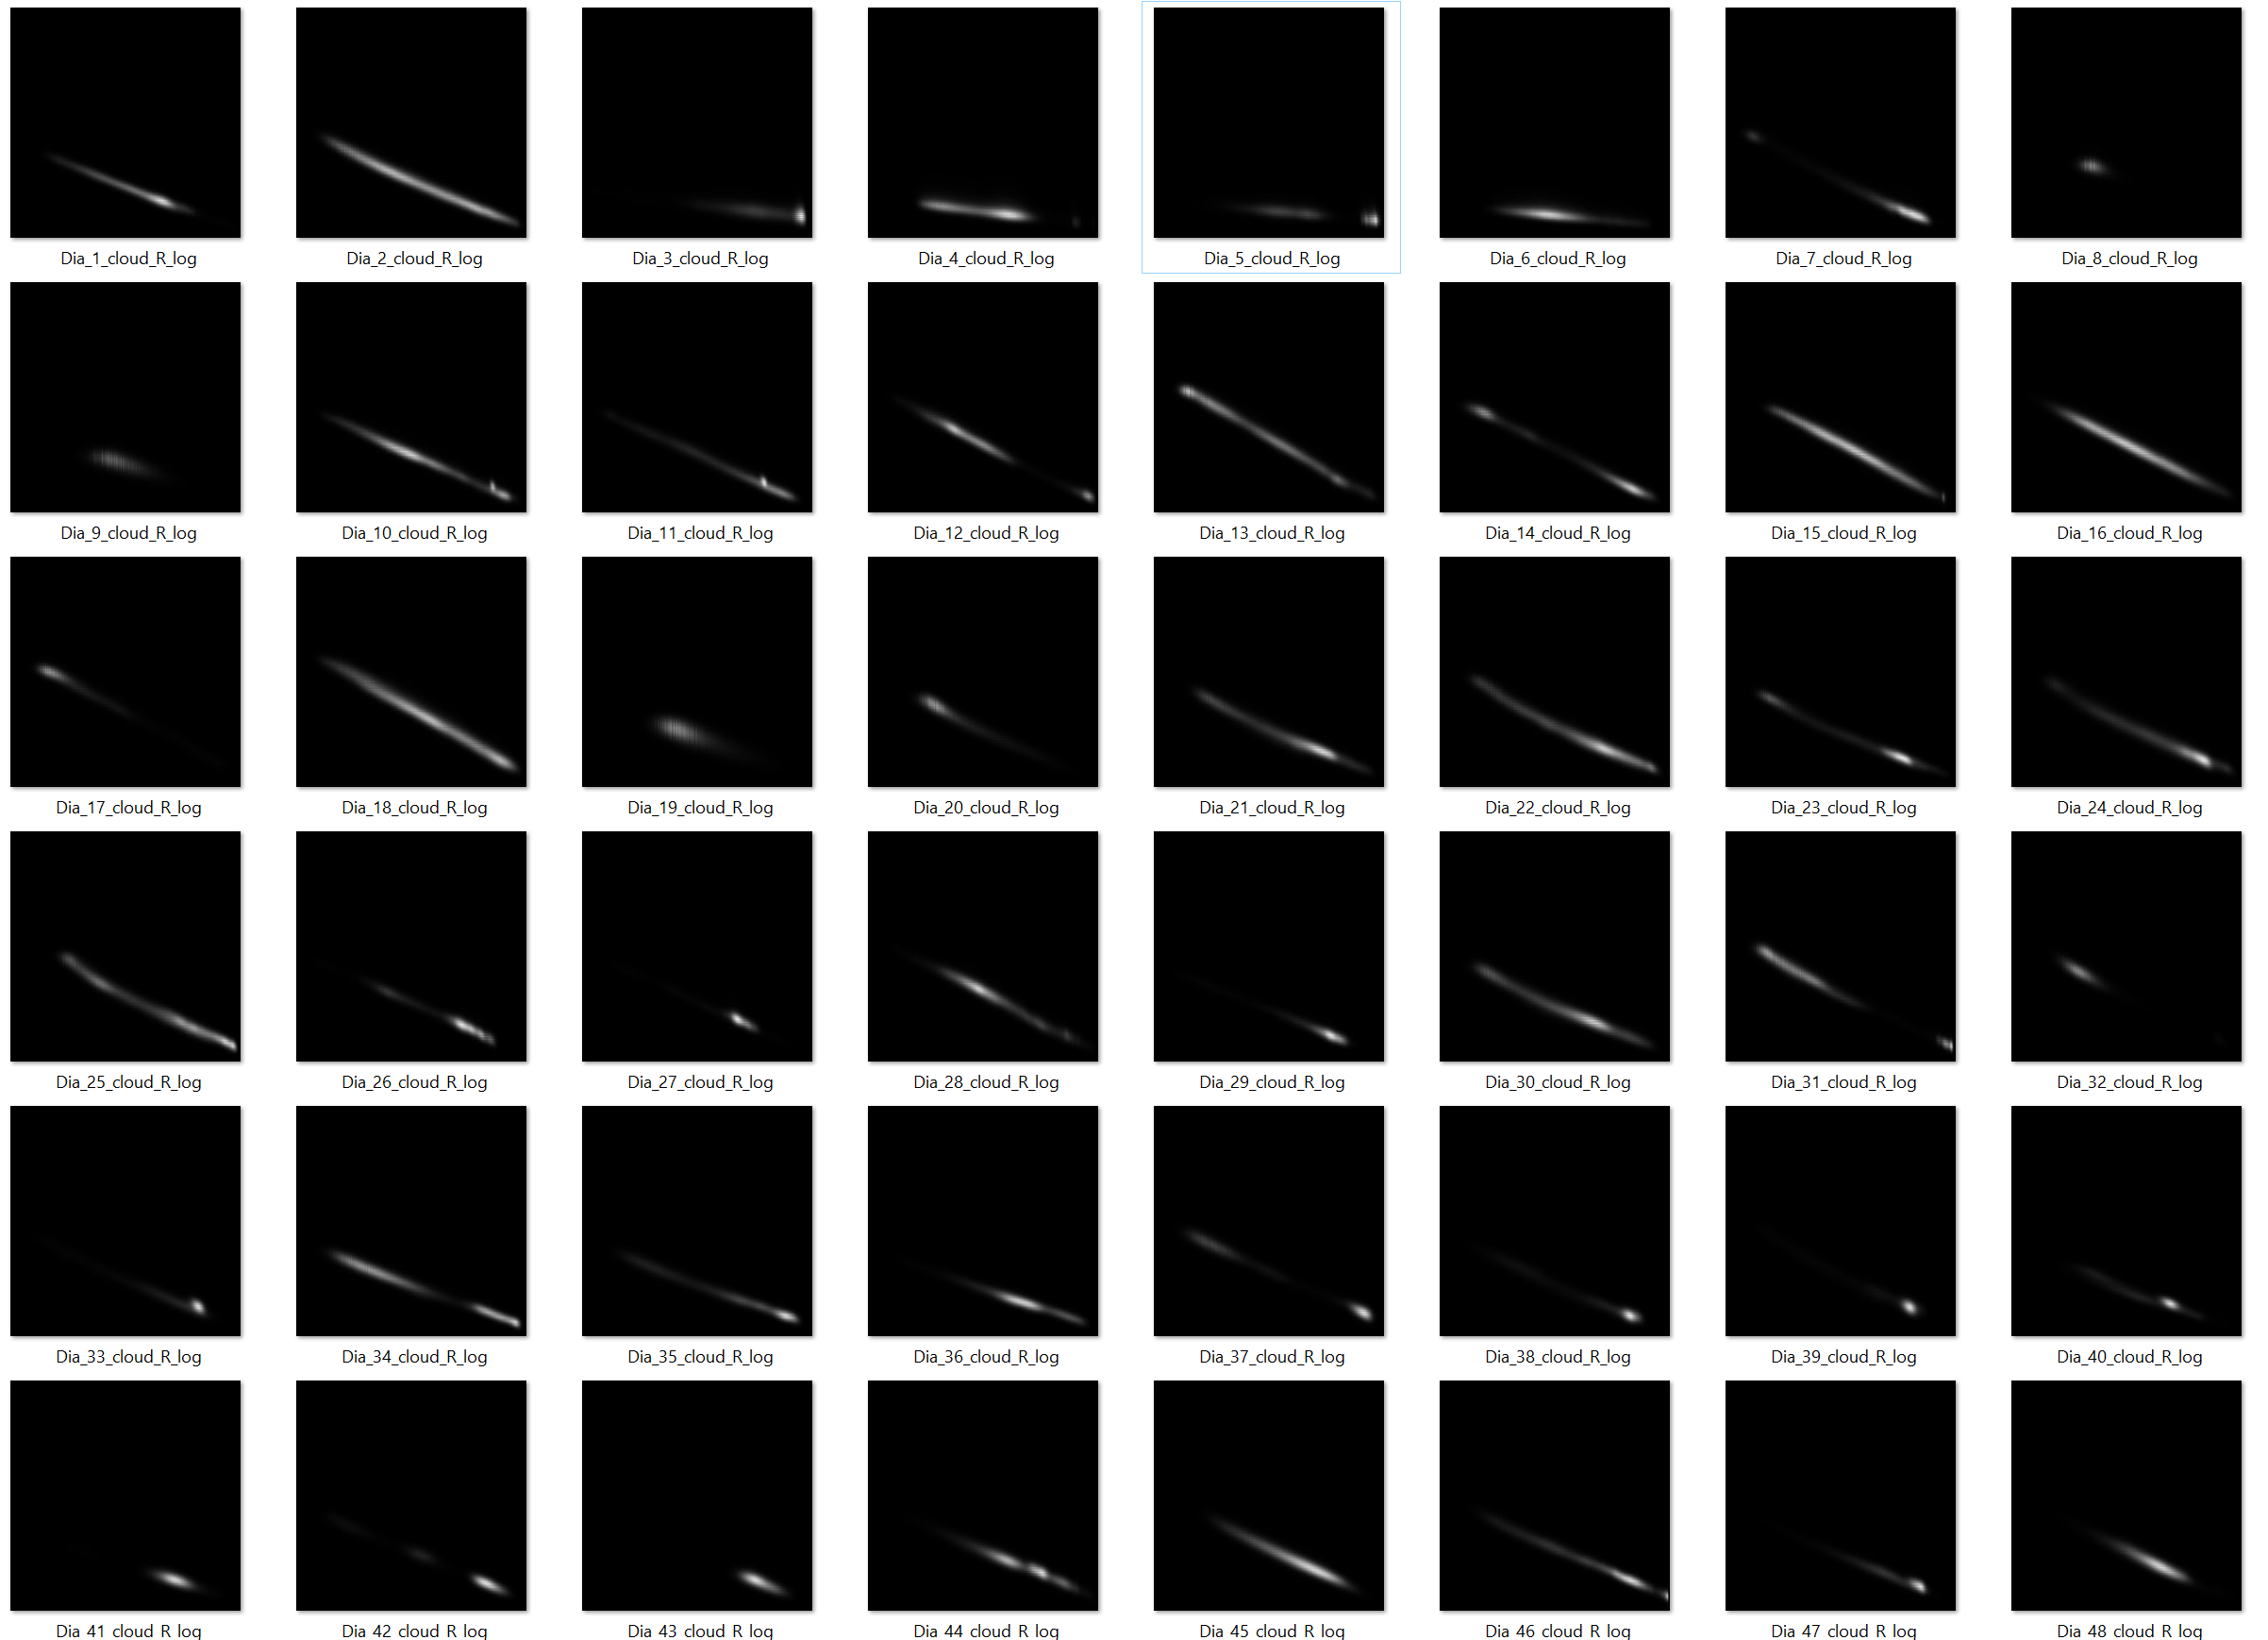
I haven’t yet studied in detail or tested the script by @garagecoder but I did a quick test with a log-linear scale (log red channel, linear IR).
The results are basically perfectly straight lines, therefore it should be very easy to remove the contribution by the visible light on the IR.
The slope of the curves is also very similar, maybe it can be estimated from a whole roll so that even slides with few points, or points very similar in brightness, can get a good estimate.
After subtraction a threshold will likely be enough, or a more advanced approach like what was suggested earlier, and which I haven’t tried yet.
For info, I did the same with a more recent slide roll I know for sure was an E6 process, and which I know was not mixed up with other rolls.
The IR channels look very much alike and the log-lin graphs are basically identical, making definitely possible the calculation of a single linear regression for the whole roll.
Yes, everything appears to be as described in the articles about IR/red channel. I think the next barrier could be noise; the match is much better in log space, but at such resolution the individual pixels aren’t likely to align. Downscaling might partially fix that. Here is the median transfer curve from indexed red channel log values to IR (red channel values shown in green, IR in red):