No one is forced to like it or to use it - no developer can implement something no one dislikes. Don’t forget: everybody’s darling is everybody’s fool
1 Like
I totally get your point, and I don’t actually disagree with you. Striving to make a module that everyone loves is incredibly challenging and maybe impossible. If this module stays exactly the same, I won’t actually care too much. I don’t hate it, and I don’t love it.
I’m just trying to look at it from all angles and understand everyone’s point of view and why it seems to be a polarizing module that consistently comes up for discussion.
2 Likes
I think the point of who personally likes it and who doesn’t doesn’t matter so much-- there are people, like me, who like the currently implementation and making all these changes without giving us a way back to the old version would be extremely frustrating.
2 Likes
Some complain about not being able to pull one node up to +2 EV without the curve going haywire.
What they didn’t mention is what that node puling does to the image (and would do even if only the selected area was effected). +2EV for a narrow section of the tonal range is not good: you would inverse the tone gradient at the edges of the selected range (“solarisation” effect, try it with exposure module and a mask for a narrow tone range…). Even with the tone equaliser in its current form you have to pay attention to that when you do large adjustments…
4 Likes
To avoid this I have assigned the two compensations to rotaries of a midi board and I attenuate while looking at the histogram
I go the opposite way, usually I do a far bit with exposure and then the rest by ToneEQ. I shot often to the sun and rarely need more than one instance of ToneEQ, so I really wonder about your corner case ![]()
I was just trying to adjust the histogram in the TE module and realise it is a linear display only. I could see an advantage in being able to switch between linear or logarithmic display to better see the full range of EV values when only a few very dark or light pixels exist. I don’t know if this is a practical suggestion or not to implement.
The tone Equalizer can adjust tonal values in the range of 0 to -8EV an the histogram shows the mask, that will be used for tonal changes.
So it doesn’t make sense, if the histogram shows something, that doesn’t have any relation to the sliders.
1 Like
This we have been told a number of times, but I still have problems getting my head around what we really see. What are those amplitudes illustrating??
1 Like
The Histogramm of the mask generated to split the image into 9 segments. This is not technically correct because I dont know the exact values and there is blending involved but you could imagine every slider affecting only a certain range of brightness values of the mask thus selecting a certain brightness range.
How to Interpret the Graph
The tone equalizer uses a mask for detail preservation. The main job of this mask is to blur areas with low local contrast but preserve hard edges. You can see the mask by clicking the circle icon. The histogram simply counts the number of pixels in the mask with a given brightness.
The 9 sliders/points are used to define the curve that you see under “Advanced.” This curve tells the tone equalizer how to change the brightness of an image pixel based on the brightness of the mask at that location.
So the mask does not split the image into 9 segments, the mask and the 9 sliders are only related indirectly.
The graph can be confusing here. The unit on the vertical axis is “EV,” which is the unit for the correction strength - for the curve. The histogram is shown in the same graph, but its vertical axis is not EV, it represents a pixel count.
About Scaling the Histogram
I am still working on the TE proposal, I just have limited time over the summer months. The bad readability of the graph is a problem that I intend to solve.
As mentioned above, the histogram defines “bins” by brightness and then counts the number of mask pixels in each bin. For the graph display, the resulting values are scaled linearly so that the bin with the most pixels translates to a bar that fills the entire available vertical space.
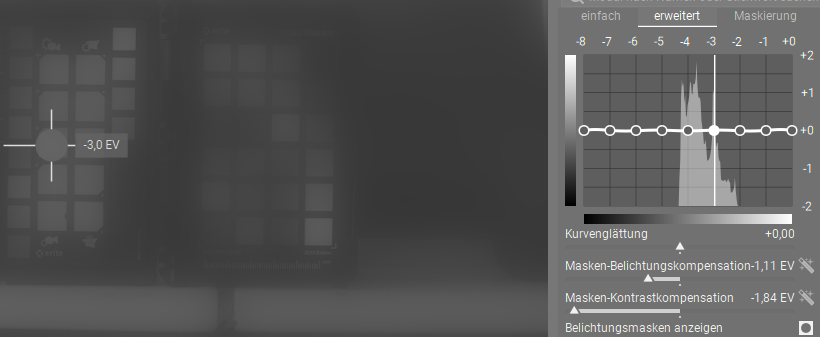
The problem with very small histogram bars occurs when the exposure of the mask is so high or low that many pixels fall outside the histogram range. For example, when many pixels are darker then the histogram range, all of those will be counted as part of the first bin. When this inflated bin is used to scale the histogram vertically, everything else becomes much too small.
A log histogram (vertical logarihtmic scaling of the pixel counts) would one way of solving this problem. I don’t like it though, because I think that it does not represent the relationship of brightnesses well. To me this is a typical computer scientist solution that does not mean much to less technical people.
A solution that I like more is ignoring the first and last bin when scaling the histogram vertically. This is implemented in my proposal and I think it solves the problem.
There was some discussion about this on the github issue, as usually this solution was not universally liked - at least not as the default behavior. So my current plan is to return to the old behavior by default, but have a button to toggle ignoring the first and last bin.
4 Likes
All that is (mostly) fine, but my question is about the amplitudes of the histogram, how are we supposed to use that information in any way?
As for the other aspects of the mask, that you address, the manual informs us that the mask is a guided mask. In my understanding of the term it means the mask is “edge aware”, and as such should presumably very much separate the 9 zones. I believe the blending is what is controlled by the edges refinement/feathering.
We have the display mask function that is somehow meant to illustrate the mask, but I have never really been able to read that - thinking some false colors might help if implemented.
(In the color balance rgb we can get the masks of the three brightness segments, local masks, illustrated at the masks tab that show the opacity of the masks distributed over the brightness range. Could something along this line be useful also in TE?)
EDIT: This was not posted until after @JovianSettler had (unaware to me) posted his explanation that clarified some of the things that I have been wondering about regarding TE. Thanks for that!
1 Like
see darktable user manual - tone equalizer
the usecase of the histogram is to indicate the spread of the selected mask over the zones. So you’re able to control the spread so you can use as much zones as necessary to do a differenciated adjustment of exposure.
the mask itself isn’t a mask like in blend mode - it’s more a greyscale false color representation of the available range -8EV and lower=black to 0EV and higher=white
- quit a lot options for differenciated adjustments
vs - just limited options for differenciated adjustment
3 Likes
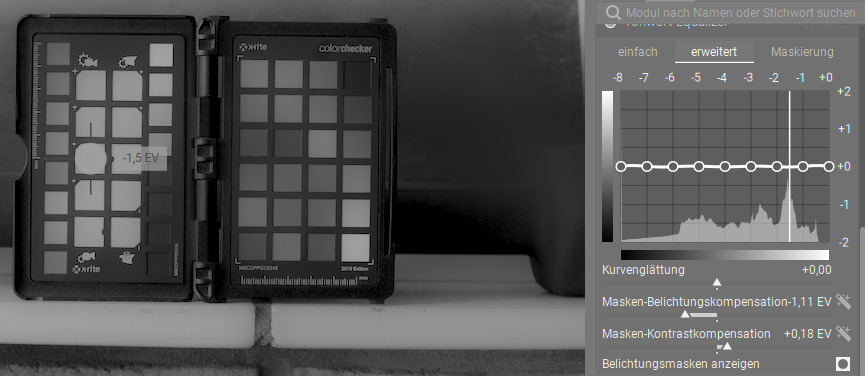
The histogram amplitude gives you an indication of which parts of the image are affected by the curve adjustments. If you see a histogram with a big mountain in the middle, dragging those central bins will increase general image brightness. If there are two mountains left and right, with a valley between them, you can affect shadows and highlights separately by dragging the left and right sliders.
The “goal” can be to equalize that histogram. Make it flatter. Push the mountains into the valleys. This will flatten the image, decrease contrast. Or conversely, to increase the contrast, by pushing the histogram towards the left and right end.
1 Like
There are two things fundamentally broken about the tone equalizer module:
- The mapping from control points to the spline that is used in the calculation is not guaranteed to preserve monotonicity, so you get overshooting. This would be extremely simple to fix, though the change would be technically breaking. Nevertheless, it is hard to imagine that a user wants the overshooting under any sane circumstances, so I guess few people would miss it.
2.The GUI does not show or control the luminosity mapping f(x), it shows the difference f(x) - x. This makes it extremely hard to judge the slope of f visually, so yes, you can get inversions easily. This is purely a GUI issue though, and could be fixed easily in a non-breaking way by displaying f (like almost all other tools to). A nostrum would be highlighting the ranges where f' < 0, eg with a yellow bar or changing the color of the curve. But mitigating (1) first would be best as it would get rid of most bogus inversions.
It is quite sad to witness this kind of response to well-meaning and thoughtful criticism. Minor details and GUI interfaces are extremely hard to get right, especially on the first time, and this module is no exception. The take it or leave it attiutude precludes any improvement.
6 Likes
You could do something extreme, like watching what happens to the image while pulling the different nodes. Personally, I rarely edit based on the slope in a graph…
It’s also quite sad to see a quote out of context, and amputated of a very relevant part. Especially important when replying several weeks and a good handful of posts later…
The horizontal display is more intuitive for users. You can easily see how much you have changed a certain tonal range, which is harder on a classic tone curve where 45° is neutral.
Also this is not just a UI issue. We are interested in preventing inverted gradients to the image. However the curve is applied based on the mask and the (blurred) mask has a massively different dynamic range than the image. So limiting a tone curve to be horizontal may cap the slope to soon, it may be safe (for the image) to go further.
My in-progress version has colored warnings, but these are just an approximation of what happens.
1 Like
So, if part of the GUI is broken, your suggestion is that one doesn’t use that part of the GUI; delivered in a sarcastic tone so that I learn that it is user error to assume that it was useful in the first place.
When editing the image, watching it change and relying on various graphical feedbacks (curve shapes, scopes, mask indicators, …) are both useful. They are not replacements, but complements. That’s why they are included in the first place in almost all nontrivial modules.
4 Likes
There are lots of people that use this and it works fine for them. Breaking functionality for them in search of some definition of “correctness” isn’t going to make for happy users.
All the conversation I’ve seen, and participated in, in the PR has been don’t break existing functionality, and if you need to then make it a new module (Tone Equalizer v2).
Improvements are made by those, who are convinced it‘s worth to spend coding effort - not by those just demanding and not willed to accept different design decisions by those who made the job ![]()
So convince by arguments or by a prototype implementation. That’s the way sigmoid or AgX made it into the tool …
1 Like
If simple then please propose a PR to be discussed. I’m all for fixing issues especially if simple. TIA.