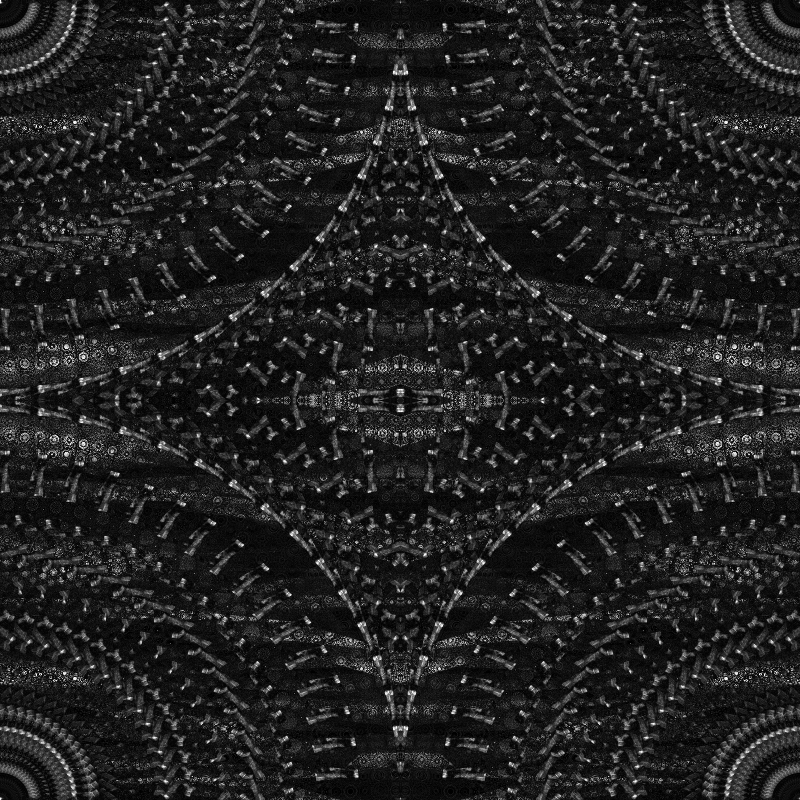
Here it is. I’ll be happy to explain any part of it. Coordinates x and y are converted to indices into a matrix. Every time a matrix element is hit, it is incremented by one. The matrix is displayed as a heatmap.
function run(tries=1000; h = 400, w = 400)
    Z = zeros(Int, h, w)
    for _ in 1:tries
        sercir!(Z)
    end
    imagesc(Z)
end

# values outside the "viewport" are shifted back into it.
function wraparound(x, xm, xM)
    while x < xm
        x += xM-xm
    end
    while x > xM
        x -= xM-xm
    end
    return x
end

function sercir!(Z,
                 # initial value
                 xi   = 6*rand()-3,
                 yi   = 6*rand()-3;
                 # "viewport"
                 xr   = (-2.0, 2.0),
                 yr   = (-2.0, 2.0),
                 reps = 10000)

    h, w = size(Z)
    x, y = xi, yi
    xm, xM = xr[1], xr[2]
    ym, yM = yr[1], yr[2]

    for _ = 1:reps
        x = x - y/2
        y = y + x/2

        xi = wraparound(x, xm, xM)
        yi = wraparound(y, ym, yM)

        # map `x, y` coordinates to a matrix location
        col = (xi-xm)/(xM-xm)*(w-1)+1
        row = (yi-ym)/(yM-ym)*(h-1)+1

        c = round(Int, col)
        r = round(Int, row)

        Z[r, c] += 1
    end
end
I can’t reproduce Reptorian’s plots with this code, though – all ellipses I get are centered in the origin; only their size changes.
Here’s one example, with random initial values between -3 and 3, with viewport between -2 and 2; values outside the viewport are mirrored back. This is 60 ellipses.
The left and right side are unfilled. It definitely would be nice if there is another expression that generates similar image, but being able to fill outside of border. But, I won’t look at finding how as basic search for solution haven’t been found, and mathematically, it’s not possible (probably).
Basically, what I’m looking for a command that cuts based on the frequency vs dimension ratio. $1 would be the parameter to find the lowest value that has a frequency higher than $1, and $2 would be the parameter to find the highest value that has a frequency higher than $2. Then, cut based on the found values. That’s something I requested on G’MIC 3.1 thread.
That doesn’t give me the output I want. I want to cut instead. Let me see. I could try to do a custom command involving sorting, and then find the frequency of each value, and cut based on those.
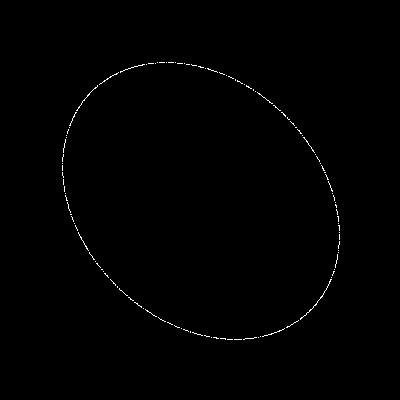
The world doesn’t have enough graphics languages, so here’s a solution in “alfim”, a language I am developing. I call sercir() only once, so there is only one “circle”. It is based on code above by @mbs, but with smaller initial (xi,yi) and without wraparound.
What I understand here is what you name “frequency” is actually the “occurence”, right ?
(Frequency in image often refers to Fourier decomposition in image processing).
as @garagecoder suggests, computin the histogram is probably the key here.
But what do you want to do with the values below or above a certain occurence threshold. What value should be used to replace the old one ?
The first channel is the value of image, the second channel is the occurence, and the third channel is the label value of the image. If the occurence is greater or equal to 5% starting from the left, then corresponding image pixel value becomes the cut value 1. If the occurence is greater or equal to 5% starting from the right, then the corresponding image pixel value becomes the cut value 2. So, with those found value, it is the cut values.
I have done something similar for tone re-mapping (the ranking and smoothing). The challenge is making it fast. E.g., colormap on large colourful images takes a while to process.