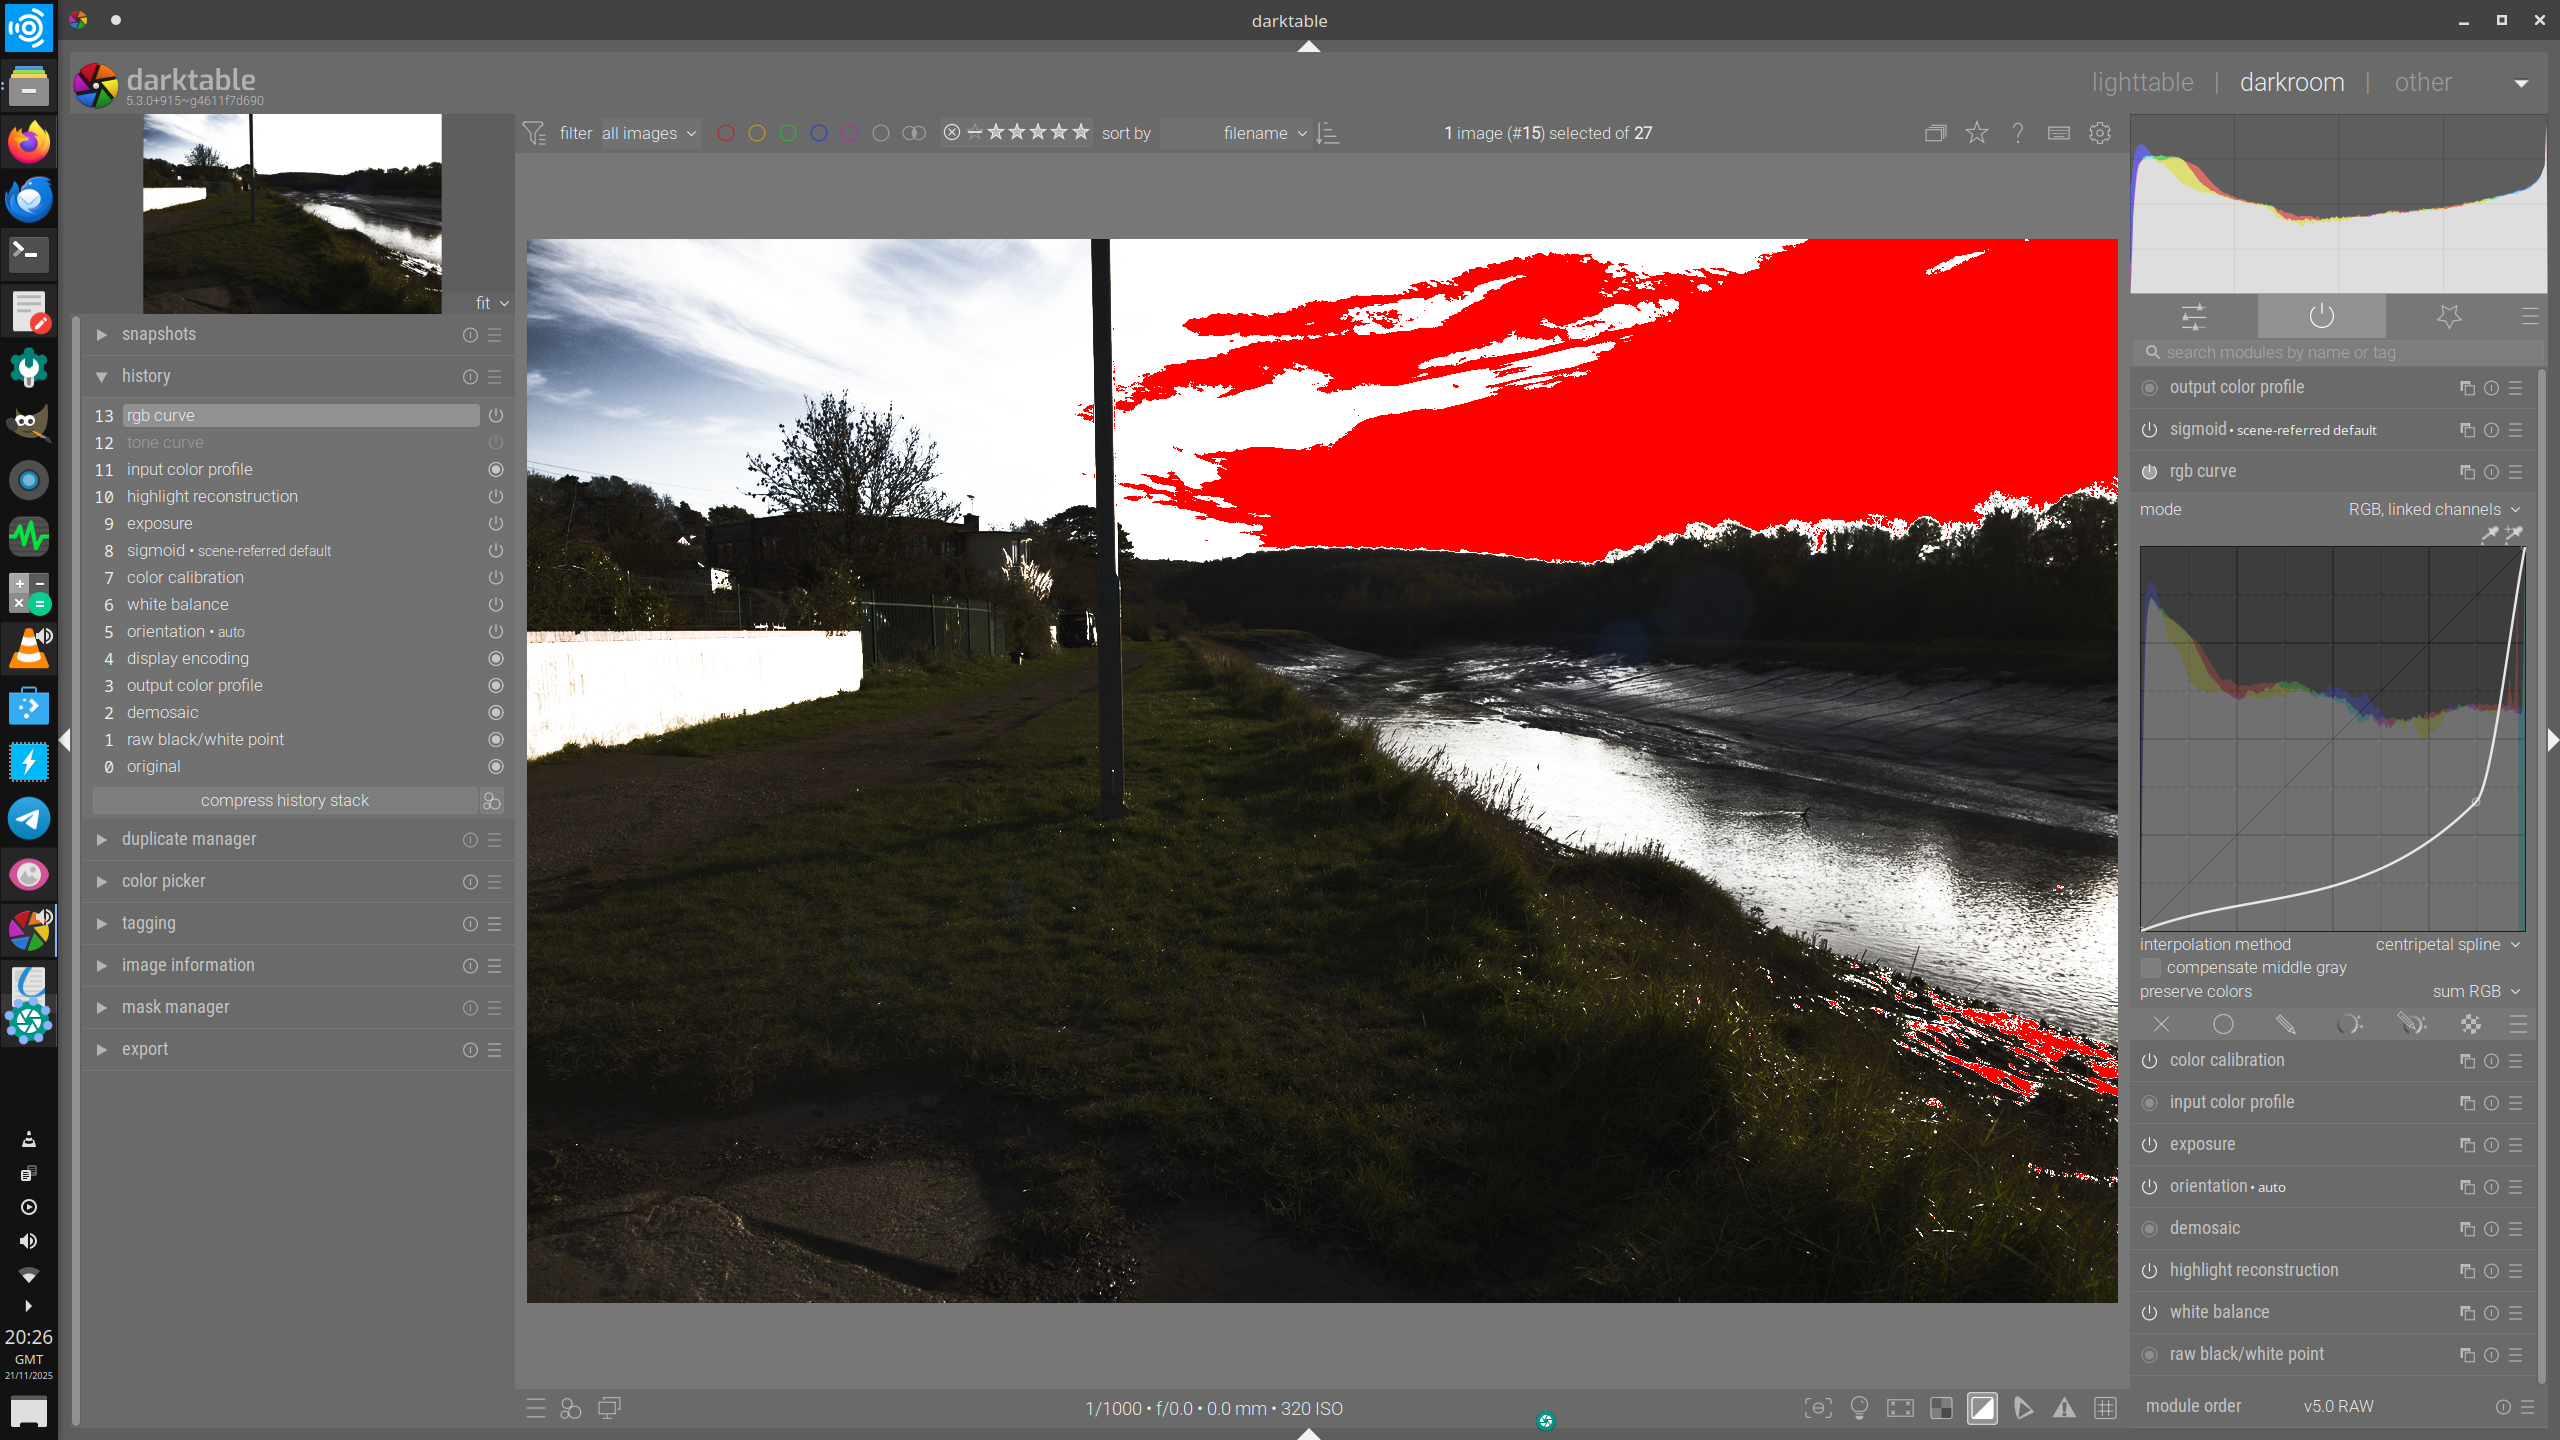
Starting with a “45 degree” straight line, if I move a control point towards the bottom right corner, I’d expect every part of the image to darken to some degree. But my sky is getting brighter! Can anyone explain / reproduce pls.
Pls see attached CR2 and XMP. If I open RGB Curve and slide the control point to the right, the sky gets brighter and eventually clips according the clipping indicator button. Tone Curve is not doing this.
This is with recent build 915 (appimage) using ubuntu studio 24.04 Plasma X11. No GPU card
Extrapolation: values above 1 will be pushed higher. You only see the 0…1 input range, and the curve is rising steeply, and continues to do so even on the part that you don’t see.
You are before sigmoid, so you are in the scene-referred part of the pipeline; don’t forget that it has values > 1.
Ah thanks, I didn’t think about the scene-referred implications.
Do you think it would be better if the right-hand boundary was extended, along with the histogram, until all or nearly all pixels were represented in the histogram? Say 99% or some value to avoid the last few extending things too far. Then it would be clear what you’re editing.
Because of the scene referred implications I would use tone curve after the sigmoid or AgX tone mapper rather than the rgb curve, which I reserve for small color tweaks mainly.
But is not the difference between rgb curve and tone curve more about its position in the pipeline before or after the tone mapper? I know its not recommended but if you dragged the rgb curve above the tone mapper would it not behave the same as the tone curve?
In a quick test by me, when I moved the RGB curve above the tone mapper it seemed to respond differently to below the tone mapper and responded more in the way the tone mapper responds.
Maybe look here in .xmp, I downed the exposure, then two instances of tone equalizer, recepe Boris Hajdukovic. One bringing the sky down retaining contrast, one bringing it back up enlarging the contrast. Key is the Masking tab > preserve details setting. 1st instance is set to ‘EIGF’ second to ‘no’ _5D_06132.CR2.xmp (20.0 KB)
Hope you’ll be able to proceed from here. Kind regards, Jetze
I think so. With it after tome mapping, I imagine they are doing much the same [0,1] process. But surely the idea is to leave it before tone map and benefit from scene-referred editing, and for this it’s the whole range that needs to edited, not just the lower part.
But how would you decide the range of the curve? Keep in mind that in its default state, x==y, but x can basically vary from 0 to ∞… and vary between images. You could of course force the module input to a limited range using the exposure and tone equaliser modules.
Of course it would respond differently: the tone mappers do two things:
force the output to a range 0…1, and
apply a log function to the values, which compresses highlights relative to shadows (“middle gray” shifts from ~0.18 to 0.5).
The module will still treat the values as linear, though, that’s how it’s written.
I don’t know how best to get the curve range if it’s per channel but suppose we’re talking LCH. So isn’t it just a matter of taking the max L then dividing that by a suitable number of bins to get a histogram. The graph x-axis would extend to the max L, points would be placed, and a curve derived by one of the methods already used. Does the graph need headroom to put points higher than the current max? I guess that’s not really necessary because you could ramp it up with Exposure prior to the RGB Curve module. Or am I missing something? Then there is the possible refinement of using logs or something to stop the top end taking up too much space (but enough space is needed to make editing comfortable).
I don’t know what you mean about “x==y” but I wish people wouldn’t talk about infinity, there’s no infinity involved!
Hi Andrew, I ask some questions respectfully and not in an aggressive manner. But why would you be pushing the RGB curve or RGB levels to such a large correction and not addressing the bulk of the exposure correction in the exposure module or somewhere else?
It seems this undesirable result you have identified only comes from pushing the module to its extremes. I personally have only ever thought of doing minor tweaks with the rgb curve or rgb levels modules.
Is this a real world editing problem or just a hypothetical question?
I guess you mean the screen grab above? That was to emphasize the issue, namely me not understanding why the sky got brighter when I thought it should get less bright. The changes I wanted would have been much less extreme, i.e. show some detail in the sky.
No, following Kofa’s explanation, which seems completely consistent with what the module is doing, the upshot is what I’ve put in the git suggestion, namely that the module only allows editing part of the tonal range. Don’t you think a tone curve module should allow you to change all the curve, not just the lower part?! You wouldn’t like it if AgX didn’t let you adjust highlights! I guess when scene-referred came along, this module got left behind somewhat.
And I don’t think you are being at all aggressive!
It Mac make sense to move the module into the display referred part of the pipeline in a future release, even if it does not truncate data, since it has unexpected, confusing effects and its controls are not really compatible with the scene-referred workflow. Doing so would not affect existing edits.
What x==y means that by default it is a strait line, where the for every x value, y has the same value. So 0,0 is a point on the line, 0.25,0.25 is a point on the line, 0.5,0.5 is a point on the line. Etc.
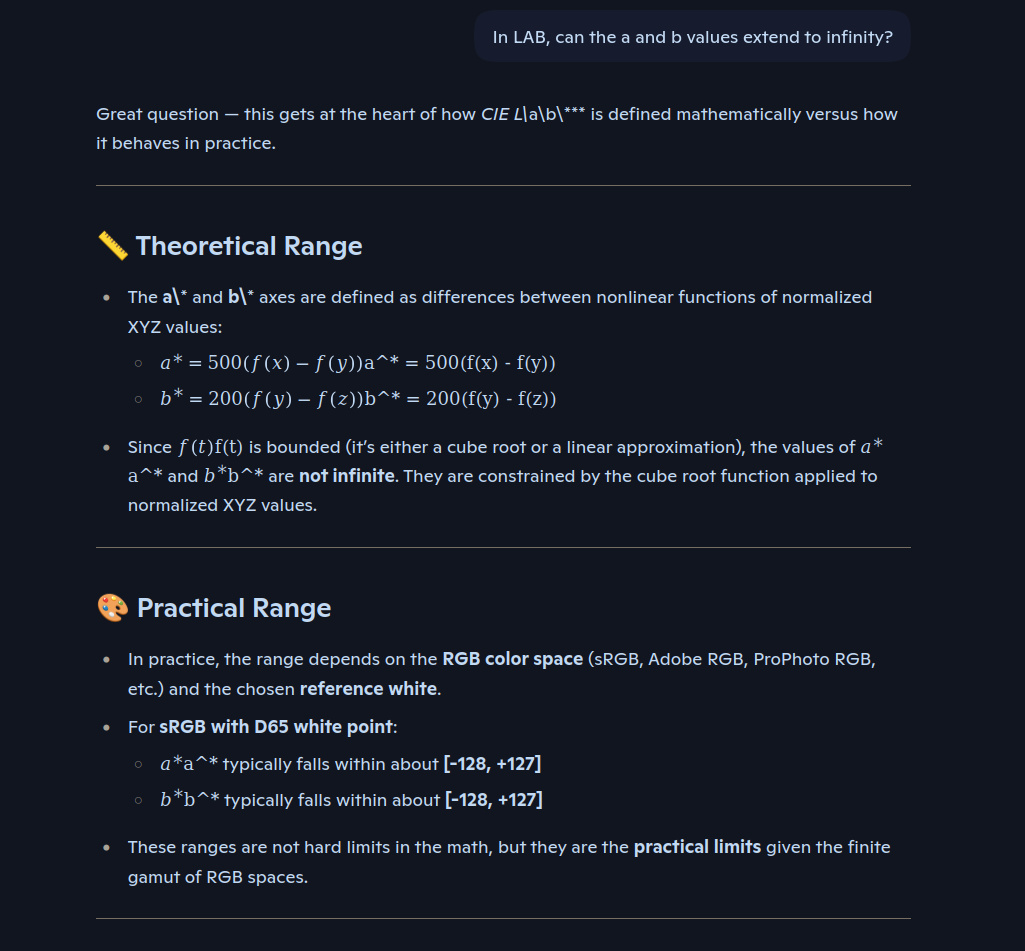
Correct me if I wrong, but for the lab colour space, it’s a* and b* axes are mathematically unbounded while L* is bounded 0–100. So from a mathematical perspective the LAB colour space is infinite. This doesn’t mean that no physical limit for the colours (a colour can’t be infinite blue), but it does mean that from time to time infinite will creep into the math. Since a graph can’t display infinite, you can get this strange behaviour.
Thanks for your reply. I understand your issue and I had never noticed it before because I only ever use rgb curve for very small color corrections. Maybe the developers can improve the module or maybe there are technical limitations. I don’t know.
I am trying to imagine your case use and wonder if tone equalizer would not be more suitable for what you are attempting.
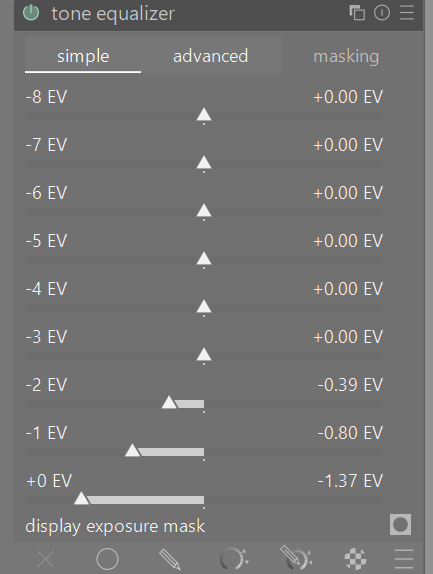
With over exposed images where I am trying to use tone equalizer to recover highlights as much as possible I tend to use the simple sliders in this fashion, being careful of strange artefacts appearing. I have no problems brightening or darkening the midtones and shadows but the highlights require special care.
Moving a point up increases brightness, moving it down decreases brightness
Moving a point to the left decreases contrast. Moving a point to the right increases contrast.
So in your example the curve went down which darkened everything that had a value less than or equal to the point you chose. But, you moved it to the right which increased the contrast forcing the highlights to blow out.
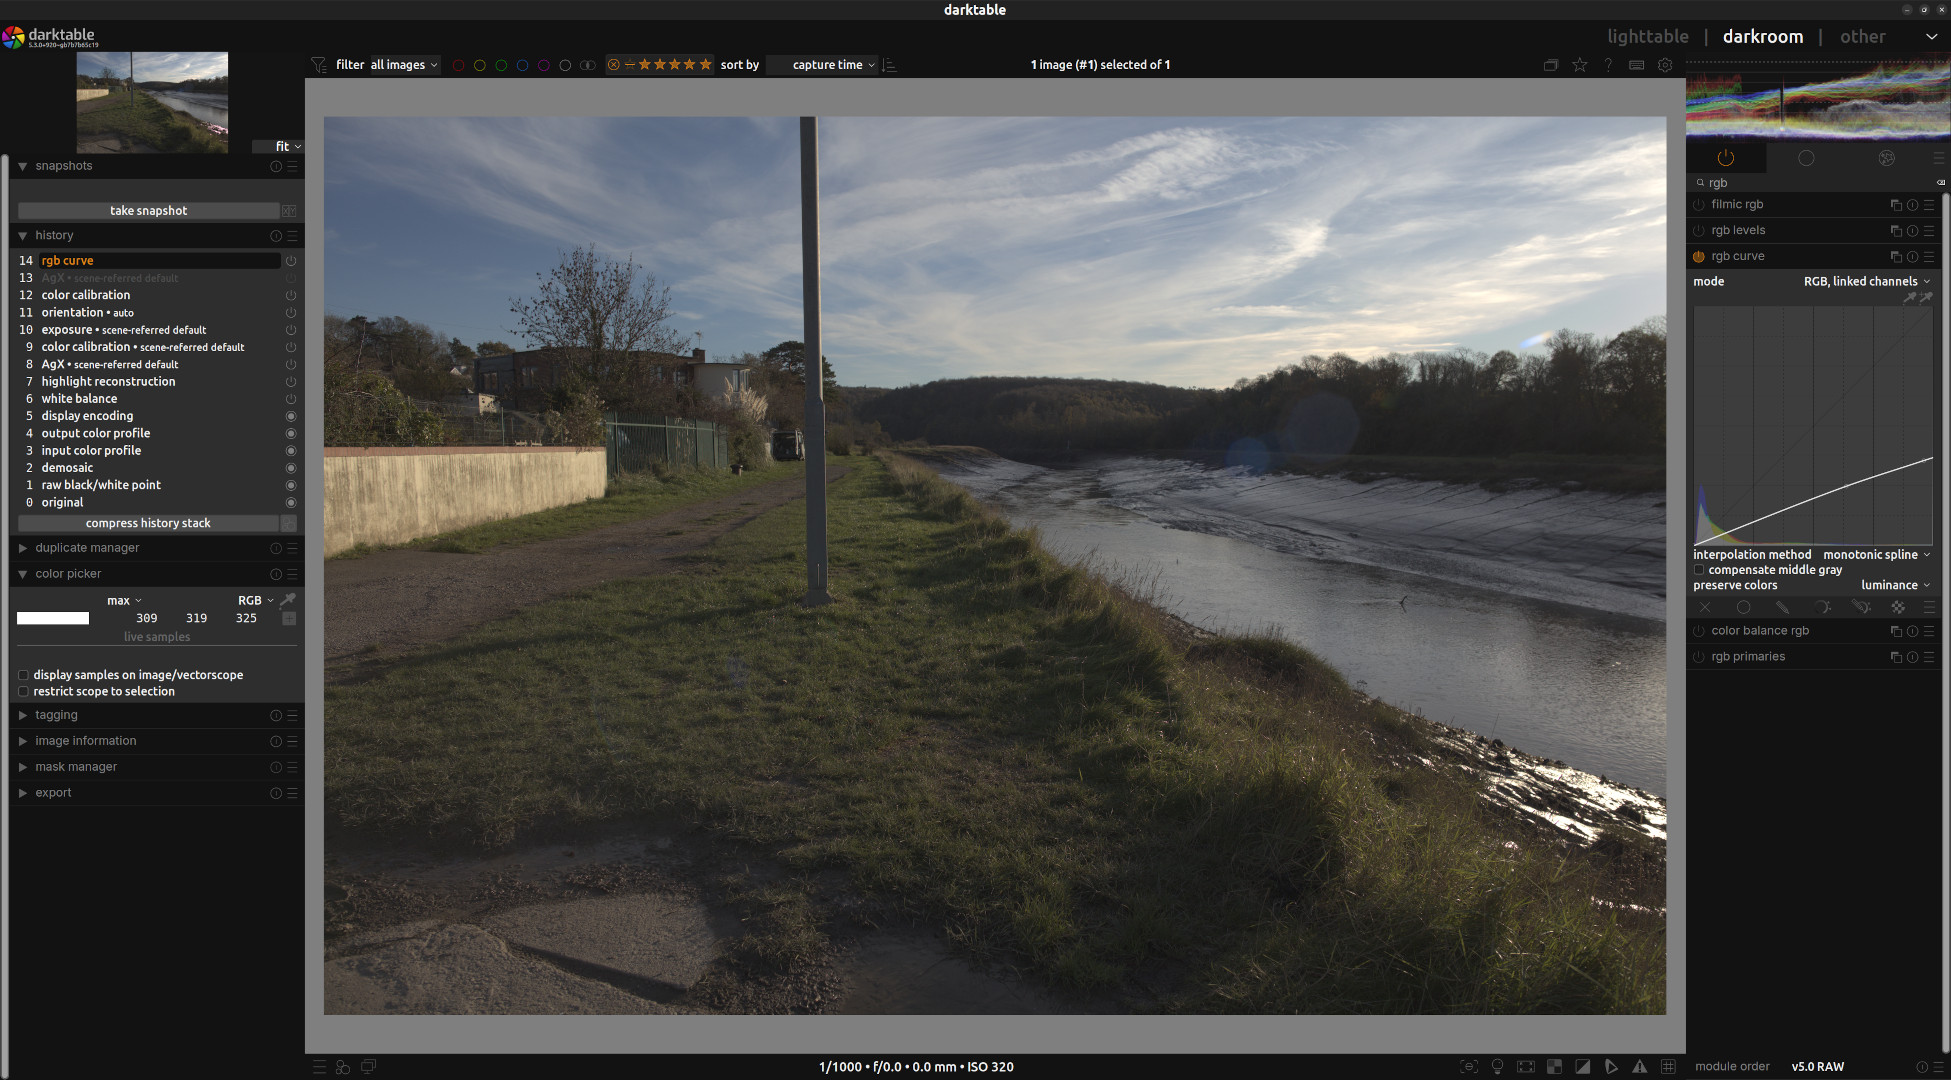
My edit with the tone curve works because I chose the upper right corner as my starting point and moved everything down (the equivalent of decreasing exposure).
@wpferguson , thanks. I can see there are ways to get something out of this pic, but that’s not the point really, the point is the module is not doing what it ought to do, i.e. allow the whole curve to be edited.
@Terry , yes I guess Tone Eq would work. I have to admit I hardly use this, I’ve never taken the trouble to get to grips with it.
@martinus , is == C notation, I can’t remember, but I understand the graph of y=x! So to the more interesting point of whether a and b in Lab involve infinity. I asked MS Copilot and it says not! Have a look -
Let’s just think about general tone curve manipulation and graphs for a moment, starting with y=x. If you add a point south or east or anywhere south-east of the y=x line then all pixels become darker (except for those with “x=1”). Yes the contrast may increase but that’s because the darks get much darker, not because the lights get lighter (they get darker, but much less than the change to the darks). For the RGB Curve module, the issue is I believe the extrapolation Kofa refers to due to the highlights being “off the end”, not shown in the module. The highlights are being changed dependent on what’s happened below them.