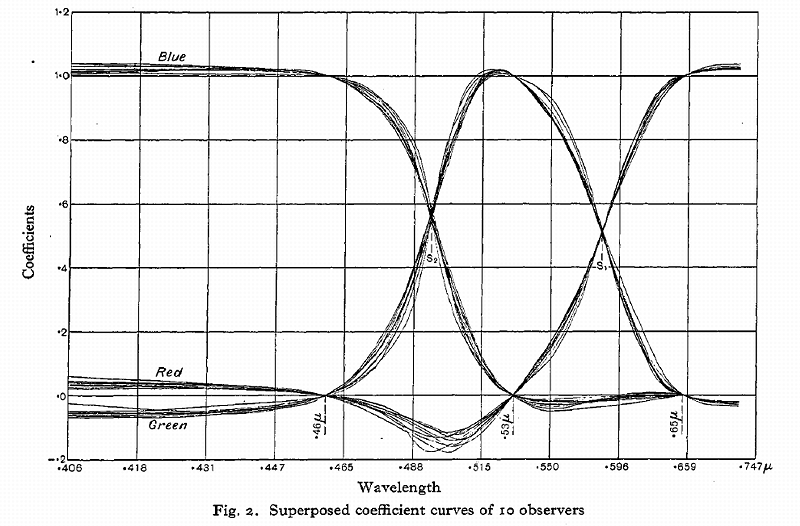
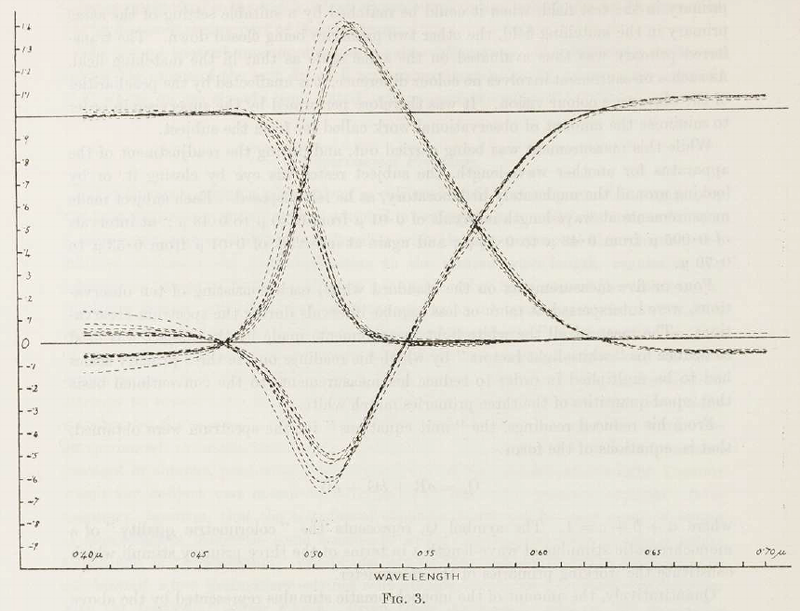
I’ve been perennially fascinated by the color-matching experiments conducted by Wright and Guild that led to the establishment of the CIE 1931 two-degree observer reference. The experiment was essentially to present a spectral color produced by a monochromator to a subject, and have them dial the intensities of red, green and blue lights to match the color. Wright collected data from ten subjects, Guild from seven. That data now informs the digital imaging we currently practice, allowing us to produce images that fairly closely represent colors at the scene.
Those seventeen subjects had to produce relatively consistent outcomes, I’d surmised, but I hadn’t gone to actually look at the data until recently. From the original papers, here are the plots of their raw observer data. First, Wright:
That is the exact topic I’m currently researching. Yesterday I pasted Wright’s graph for a forthcoming web page. As Wright says, in his diagram the wavelength scale is not uniform, which makes comparison awkward.
I couldn’t find Guild’s data or paper online. Can you point me to it?
Turns out I found it 7 days ago, and downloaded it, but then forgot I had found it.
My head is currently spinning with how they figured out recalculating coefficients of the primaries, to normalise to each other’s data and later to the new CIE RGB standard before they invented XYZ.
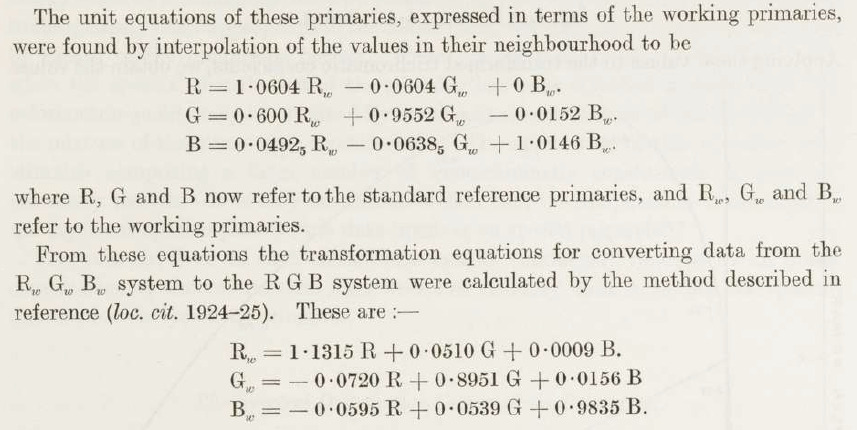
As Guild says, “… the values here given can easily be converted to such new basis”. But he doesn’t say where the numbers in the equations on p163 come from. I think I’ve figured it out, but need to test this.
There is a computational neuroscience researcher in our Institute that’s been working for a long time in perceptual color spaces and how humans reconstruct and recognize color from an information and physical point of view (she’s a physicist by training). At some point she was even interested in reproducing these original measurements with modern tools (we were partially involved in that, lack of funds and students derailed the effort). Currently she’s focused in color discrimination, making pretty neat experiments with somewhat low-tech equipment (a normal computer monitor color calibrated by hand with a silicon power-meter).
A useful resource is the “Colour & Vision Research laboratory database” at http://www.cvrl.org . This contains many CSV files of current and historical colour matching functions etc.
A software issue has caused problems the CSV files to begin with <br />, and to be truncated. Thanks to the helpful people at CVRL, today the problem seems to have been fixed.
I must add that their latest results are not published yet, I saw a talk from one of her students a month ago with new experiments trying to quantify the metric of the color discrimination (the size and orientation of the ellipse of “similar colors” around a point)
It’s taken me a month to figure out most of this, but kept coming back to those equations. The coefficients in the first three come from simple interpolation. I figured that if we call those coefficients a matrix, which we than invert and normalise so each column sums to one, that should give us the second group. But it didn’t. I couldn’t reproduce the coefficients of that second group of equations.
So my figuring was wrong. Read load of other stuff, remind myself what matrix inversion involves. My understanding was wrong, or my logic, or my arithmetic. Checking my arithmetic was easy, checking my logic was harder, and checking my understanding almost impossible.
Read more stuff. Today I discover Broadbent, Derivation of the 1931 Standard Observer “Calculation from the original experimental data of the CIE 1931 RGB standard observer spectral chromaticity co-ordinates and color matching functions.”
Broadbent says a coefficient in the first equation “0.600” should read “0.0600”. Oh, what a difference a zero makes.
I check the interpolation. Broadbent is right; Guild’s number is wrong. Plug in the correct number and the matrix inversion and normalisation gives the second group of coefficients.
I would send an email to John Guild, requesting compensation for the hair I have torn out, but he is long gone.
Reminds me of grad school years ago. I was using coefficients from a paper on Raman Spectra by Placzek and Teller from the late 1930’s. But there were a couple of errors.
So of course I recalculated everything myself.
Edward Teller became better known for the Jahn-Teller theorem (another brute/force calculation) and subsequently for the Hydrogen Bomb. And for undermining his ex-boss, what’s-his-name? Oppie something…
Thank you for these links. Just today I was reading on these things and the amount of hand waving about the experiment setup was starting to get to me. (The same goes for the D series illuminants etc: 600+ data points contributed from 3 different countries, north facing windows, across all seasons, etc.)
Journal,
Optical Society of America and Review of Scientific Instruments ("O.S.A", "JOSA"), 1925.
Includes Chromatic visibility coefficients by the method of least squares, Judd, 1925.
Transactions, volume 27 no 2Optical Society, 1925-1926.
Includes
The transformation of trichromatic mixture data: algebraic methods, Guild, 1924,
and A trichromatic colorimeter suitable for standardisation work, Guild, 1926.
Transactions, volume 32 no 1Optical Society, 1930-1931.
Includes On the fixed points of a colorimetric system, Guild, 1931,
which discusses the requirements for standard primaries and white.