The chromaticity diagram comes out like this:

So there are blue pixels that are apparently outside the horseshoe, hence not observable.
The chromaticity diagram comes out like this:
So there are blue pixels that are apparently outside the horseshoe, hence not observable.
And opening the raw in RawDigger and saving as RGB Tiff …
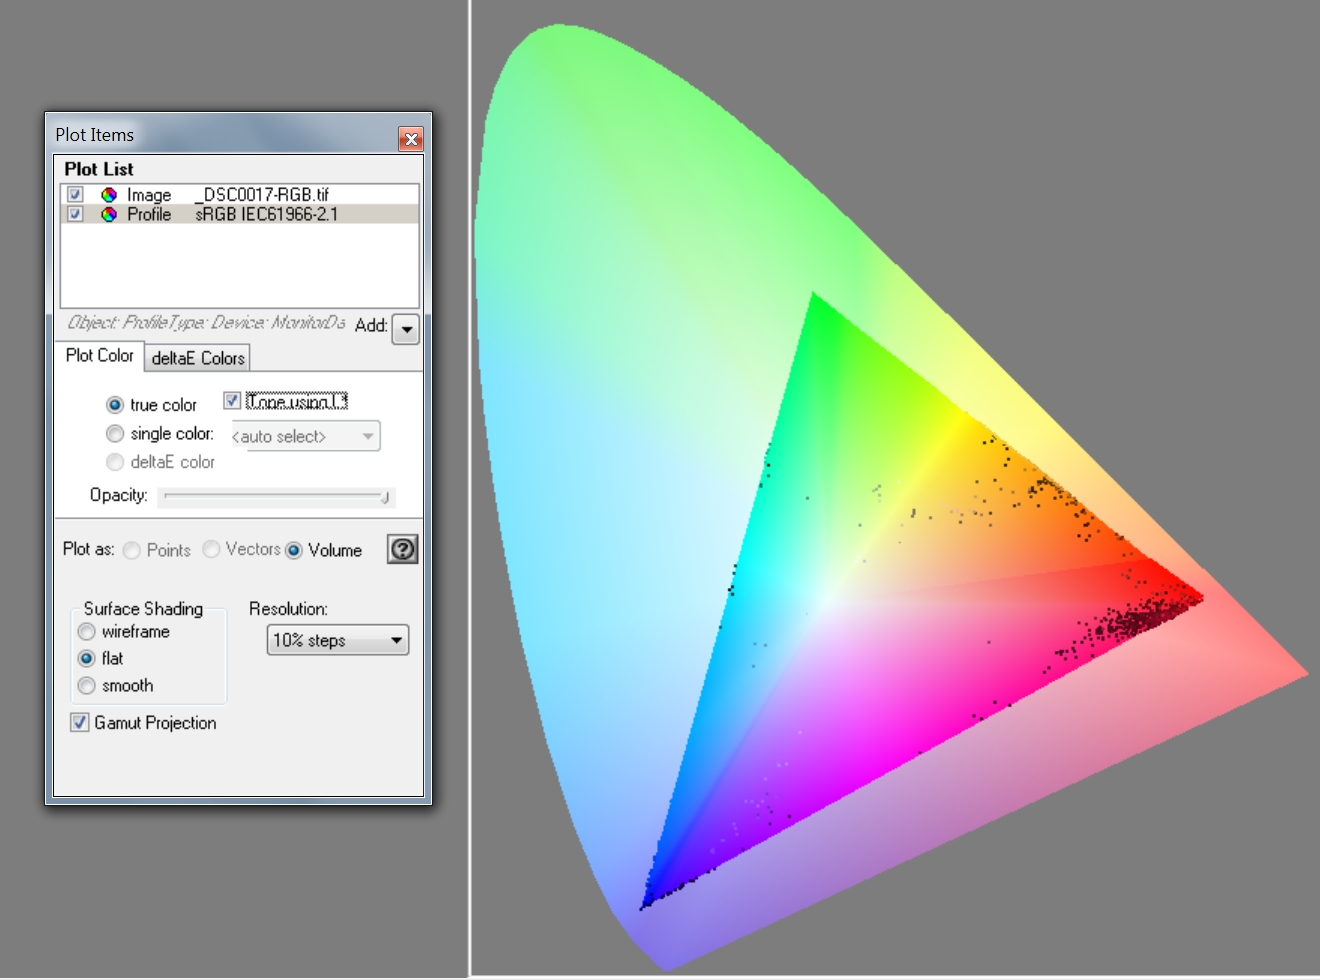
much the same thing in ColorThink 2D xyY …
Lots and lots of gamut-clipping in sRGB space, let alone Rec.2020. If someone edited to taste in a wide gamut, then saved as sRGB for the web, that would do it.
I wonder if it would ever be possible or desirable to have a raw histogram option incorporated into DT? I for one would find this interesting.
You can also use “RGB Primaries” module in Darktable to reel those primaries into your desired gamut, by reducing purity of problematic primaries.
Don’t worry about the gamut check to much, unless you see loss of detail or colour shifts that bother you. As far as I know, in darktable’s pipeline, even out-of-gamut colours (those with negative components) are usually handled well. There are a few places where colours are compressed/gamut mapped (for example, filmic, color balance rgb, color calibration), and one can also apply hard clipping in color calibration, if needed.
Oh interesting! Thanks everyone this is super helpful!
@snibgo, what did you use to make that plot, out of curiosity? @Terry It would be so cool to see pixels plotted relative to the bounds of various color spaces in DT! More or less like the CIE plots shown here. I’ve been wanting to see something like that in order to wrap my head around it and was thinking about breaking out python or matlab/octave to do it haha.
In the interest of really, actually understanding this, let me try to talk through it from the ground up; please correct me where needed. Also, apologies if this is too deep down the rabbit hole, I’m just very interested to learn ![]()
— Deep Dive —
Ok so first, each pixel collects light within a given band (approximately Red, Green, or Blue) and outputs a number from (for the sake of argument) 0 to 1, proportional to the amount of light it collected. Any combination of pixel values at this stage have real physical meaning and so can’t really be outside of the CIE 1931 color space (the horseshoe, as @snibgo put it), even though they aren’t in a well-defined CIE color space yet. Those pixels are then more or less interpolated (demosaiced) in one of a handful of ways, generating single pixels with 3 color channels each (values also between 0 and 1). At this point, there are a number of artifacts that can creep in (aliasing, zippering, etc.), but these are still values that correspond directly to the amount of light received in a certain band, so there can’t really be a combination that is non-physical. The trick, however, is that these RGB values refer to the total amount of light within a certain band, as opposed to what combination of a few very specific primary colors would be required to create the impression of the original color the sensor was exposed to. This is what the input color matrix is doing, but it is not a trivial task because our cones have quite a lot of overlap so it cannot just be a direct mapping.
Now, we would want to map this directly to an independent tri-stimulus space like XYZ or LMS, and this is where imaginary colors can get generated. Ideally, this mapping would be contained within CIE 1931 but any map between these two spaces would have to be based on real-world experiments and so probably requires some interpolation. If that is done by an algorithm rather than a simple LUT, I would guess it’d be optimized for more “common” colors and likely has some distortions at the extremes, which could accidentally bleed into imaginary colors?
— TL;DR —
The implication here is that the fix for the imaginary color problem is to get a better input color matrix that is optimized for more saturated colors (and for my specific camera, for that matter). Would calibrating with a color card do the trick you think?
As for just being outside of any usable color space like rec2020, it seems like it is just normal for a camera’s gamut to be way wider than most useable color spaces so I just need to artificially tweak the colors to get what I want (as @AD4K said), or else just live with the clipping DT does automatically.
— end —
@kofa: yeah, I guess I’ve been worried about it for two reasons: 1) I’m just curious and would like to understand what’s actually happening better and 2) I’m planning to get a print made of some version of this and I’d like to know where the limits of the printer’s profile is so I can get the most vibrance out of it I can. It would be really nice to be able to separate where in the pipeline things are being clipped for both debugging reasons and also in order to get a better handle on #2. I think being able to plot pixels against the color space in question (as @Terry was suggesting) would be super useful for that as well.
I think if your sensor is somewhat sensitive in the range outside of what the ‘horseshoe’ represents (very low red, near infrared and the same situation at the other end of the spectrum), you could have signal corresponding to non-/hardly visible radiation, which can only be represented by ‘imaginary colours’.
Yeah I was thinking that too, but the camera/computer doesn’t have any information about what wavelengths were stimulating, e.g., the red pixels; it only knows how much those pixels were stimulated. It is certainly possible that the input color matrix is somehow able to distinguish this (maybe when the red pixel is really truly the only thing being stimulated it assumes the color is near-infrared, but that could just as easily be a nearly pure tone in the normal range, e.g. from a screen), but I feel like the default color matrix wouldn’t be that extreme? Idk that’s speculation on my part though.
The raw exposure indicator shows some channels blown so you have missing data to start with. You can look at the vector scope as a guide for saturation and color gamut excursions… it will show them based on what you set for the histogram color space…you also need to do a check on your chosen display profile as it can clip and mask gamut excursions. Your displayed image will change don’t worry but if shifting your display profile between linear rec2020 and your current one changes your gamut excursions then likely your display profile is clipping …there is no problem for unbounded profiles but many can introduce a false reading due to clipping because it comes before the histogram profile processing in the pipeline…a bit of a glitch for certain profiles
Interesting. If I put working/soft-proof profiles on ProPhoto and swap between system display and ProPhoto, I don’t see much difference in clipping. I’m pretty surprised though since, I mean my display is decent, but I didn’t think it was that good haha. When I change the display to sRGB though, it does change things, so it is doing something at least.
Didn’t know it comes before the histogram! You’d think that would at least be switchable, since I’d want to know what’s going into the final file I’m exporting, regardless of what display I’m viewing it on…
Unfortunately, the vector scope/histogram doesn’t work for the particular printer’s profile I want to use (because that’s just my luck haha). I get a popup that says “unsupported vector scope profile. it will be replaced by linear rec2020”, but the display goes blank.
Sorry, a bit over-simplified, I reckon.
For example, some cameras collect a little IR in the red channel and that really is “outside of the CIE 1931 color space”.
As you know, IR is not “light”.
Fair point. Maybe a more precise way to put it is: they are realizable within CIE 1931, since they cannot have been created by a source outside the curve of pure frequencies, as would be the case for imaginary colors. However, because information is lost by binning large groups of wavelengths into just three channels, it is possible for some sets of pixel values to be metamers with spectrums that do contain wavelengths outside of CIE 1931. It could be interesting to find out if some “colors” in, say, IR are distinguishable from other normal colors, maybe through leakage to neighboring pixels or something, but that sorta falls into the realm of defining the input color matrix I guess.
This flower is a good image to demonstrate if your profile might clip and hide some out of gamut…
Its close if not out of gamut so a small tweak can send it right over the top… then you can try your linear profile / display profile swap and see how much change you see any marked gamut changes… I found that my calibrated profile did indeed do some clipping… it was a shaper/matrix profile that I made using displaycal and my x-rite screen calibrator
Well, when I opened this it seemed to have bugged out because I just get a mess of white pixels. When I go all the way back to white balance in the history it gives me just purple (and the white balance module sliders are set to extremes). However, if I reset the history, everything is fine and I don’t see any gamut clipping with the system display profile, so I think we’re good there.
Duplicated and reset sidecar attached.
2024-06-02-6885_01.ARW.xmp (6.0 KB)
Oh if anyone has any recommendations about debugging the problem with the histogram, here is the offending icc profile.
BayPhoto_MetalPrints.icc (9.1 MB)
That is a printer profile. Can dt open it as RGB and provide a meaningful histogram ?
Here’s the CMYK curves:
I agree with @xpatUSA that the camera may have some sensitivity to infrared, but I suspect the sensitivity is small, and that the photographed scene had very little IR.
The implication here is that the fix for the imaginary color problem is to get a better input color matrix that is optimized for more saturated colors (and for my specific camera, for that matter).
Yes. Ideally, we need a better transformation than a simple matrix.
Would calibrating with a color card do the trick you think?
A colour card, placed in that scene, illuminated by those saturated lights, might give useful information. Failing that, a simple gadget could be built with red, green and blue LEDs. Photograph that, then figure out what input matrix puts the results inside the horseshoe at least, and preferably inside the Rec2020 gamut.
snibgo, what did you use to make that plot, out of curiosity?
First, I developed with dcraw into a file encoded in XYZ, then used ImageMagick to convert that to xyY:
set SRCRAW=C:\web\im\_DSC0017.NEF

%DCRAW% -v -4 -w -W -o 5 -T -O sxs_src.tiff %SRCRAW%

%IMG7%magick ^
  sxs_src.tiff ^
  -set colorspace XYZ ^
  -colorspace xyY ^
  -depth 32 ^
  -define quantum:format=floating-point ^
  sxs_xyy.miff
Then the Windows BAT script xyyHorse.bat, shown on Squishing xyY into shape
plots the pixels on a x-y scattergram. When any pixel falls in an output bucket, the bucket is made white. So this doesn’t tell us what proportion of pixels are in each bucket. That’s the diagram I showed upthread.
call %PICTBAT%xyyHorse ^
  sxs_xyy.miff ^
  sxs_xyy.png
Over that diagram, we can superimpose a grid, and triangles showing the gamuts of AdobeRGB1998 (smaller triangle) and Rec2020 (larger triangle):
call %PICTBAT%profNums %ICCPROF%\AdobeRGB1998.icc pref a.png 512x512 None
call %PICTBAT%profNums %ICCPROF%\Rec2020-elle-V2-g10.icc pref t.png 512x512 None

%IMG7%magick ^
  qwe\sxs_xyy.png a.png t.png ^
  -compose Over -layers Flatten ^
  c.png
The result, c.png, is:

We can see that the image is outside the Rec2020 gamut both near blue and near orange (between the red and green primaries).
Yes, I must agree that particular scene had very little IR. I was responding to the general statement about what was inside or outside the chromaticity boundary.
Brilliant, Alan! Serious analysis indeed … I’m impressed …
Wow thanks so much for the in-depth explanation, @snibgo! I will definitely give this a try next chance I’m able.
@xpatUSA, yeah that’s right. I thought that the other profiles they provided worked, but I just checked again and it looks like I get the same warning for all of them, but sometimes the histogram appears and sometimes not. I’m not sure how I would open it as RGB though, would it be a change-the-extension type thing? DT does import it correctly, if that’s what you mean. It works fine as a softproof profile, the histogram seems to be the only thing choking on it.
earlier I posted your raw opened in Raw/Digger and saved as RGB albeit as a 1/4 size JPEG. You could open that in DT and go from there …
Or I could give a link to a full-size PNG or TIFF.
Not sure that “open as” applies in this case. More like opening the raw in one app. then “exporting as” in a different format e.g. JPEG, PNG, etc.