Can someone help me understand what the Contrast curve on a mask does, exactly? I’ve been able to deduce this so far:
The vertical axis is the transparency / opacity of the masked and / or non-masked areas - Fully opaque at the top, fully transparent at the bottom
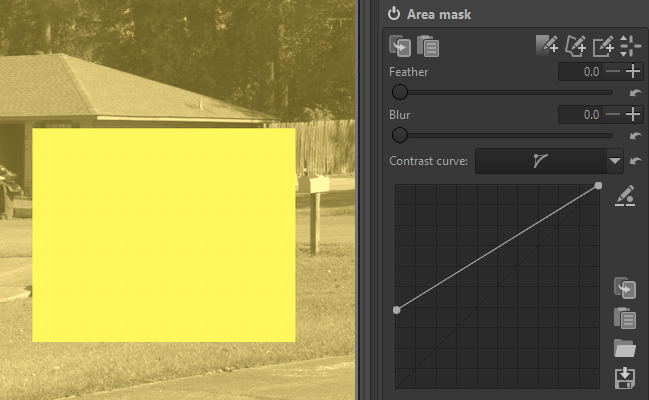
The right dot (red in the ART UI, but yellow here to visually correspond to the yellow text) controls the opacity of the masked area while the left dot controls the opacity of non-masked areas
(I assume the behavior is the same for all mask types, I didn’t experiment with other types.)
So what does the horizontal axis represent? Maybe I’m tired tonight but I’m not recognizing the actual effect, maybe I’m just dumb. I see somewhat symmetrical / mirrored effects (between the two curve endpoint adjustments) but I can’t nail down what they really are, specifically. AFAICT adjustments along the horizontal axis have effect only if Feather and / or Blur are greater than zero.
I think and this is not likely technically the correct way to explain it but it appears to manage the transition from masked to unmasked. So if you have no feather or blur there is no transition happening the regions are masked or unmasked. The left node goes 0-100 opacity and is used for the region not defined by the mask and the same for the right side but that pertains to the mask. Now if you introduce feather or blur you have a range of mask intensity/opacity say in your last screen shot from 40 or 50 to 100 if you keep the left and right nodes as shown and then you basically have the ability to alter the mask opacity profile/contrast with the curve between those set points… if you take it up sharply the feather will be similar in opacity to the mask and if you drop it then the feather is flatter… so the left and right are the setpoints for the masked and unmasked areas and the curve alters the contrast between the two when there is a transition in place with a blur or feather… A further modification is found in the post processing where you can alter the contrast of the mask with a tone curve …so a traditional input-output on the overall mask values defined by a tone curve… At least this is how I see ti working…
Hi,
The curve is just a function from [0,1] to [0,1], similarly to other curves. Of course, if the input mask only has values that are 0 or 1, but no value in between, then only the extremes of the curve matter. But try with a more complex mask (e.g. by playing with the parametric curves) and you will see that the contrast curve works as usual…
Yeah, that kinda makes more sense after looking at the behavior on a less contrived example. I think by the time I’d get into this territory, I’d be deep into mask fine-tuning.