In my experience, the Filmic RGB graphs and its documentation are misleading to the point that they hinder understanding of how the module (and the pixelpipe) really works. Here, I write down what I have found out by examining the source code. I would have loved to know this when I started to learn Darktable, so perhaps others will find this interesting.
Here are the questions that I had:
Looking at the x-axes of the different plots, what is the difference between “EV scene” and “% camera” in the “log”-plot? Shouldn’t “EV scene” and “log of % camera” be the same thing (up to a linear scaling)? But in the plots they clearly aren’t.
What does 18%, 100%, and 295% camera mean?
What is the difference between the “look only” curve and the two other “look + mapping” curves?
Here are the answers:
The function that Filmic RGB uses rescale the axes for the “log” plot is not a logarithm function, but something based on a logarithm, but that behaves very differently for small values:
The value of base that is used is 20 (see constant LOGBASE in the source code).
“18% camera” refers to the input tone that is going to be mapped to “target middle gray”. “100% camera” is just 100/18 times that value, so OK, if that “18% camera” corresponds to a gray card, the “100% camera” corresponds to a white card illuminated by the same light. This tone is generally not going to be mapped to target white, nor does it correspond to the tone at which the sensor saturates. It’s some arbitrary tone! “295% camera” in the default settings corresponds is just the filmic white point.
All three graphs show the complete filmic tonemapping curve, only with differently scaled axes.
In the “look only” graph, the x-axis is logarithmic, and the y axis is power-scaled according to the “hardness” coefficient (it can be changed, but this must be enabled first with a checkbox). Now if we kept that graph as-is, but replaced the axes by linear ones, it would show the filmic spline, i.e. the tonemapping curve without the dynamic range mapping (which is applied before the spline) and the output transfer function (which is applied after). This is why this graph is labeled “look only”, but the fact is that with the shown axes, it does display the full tone mapping curve!
In the “look + mapping” graph, both the x- and the y-axes are linear. So, in filmic’s strange logic, it now “includes” the stages that were “omitted” in the previous graph.
In the “look + mapping (log)” graph, both axes are pseudo-log-scaled using dt_log_scale_axis (see above).
The other difficulty with trying to understand what the module is doing is that playing too much with the module breaks the curve. E.g. press “auto tune levels” at the start, fiddle with parameters, decide you made things worse, undo the changes you’ve made, press “auto tune levels” again, it doesn’t go back to where you thought it would. I suspect it is due to the many iterations the module and algorithms have gone through, and the many nested calls and if-else checks in the current source code. Some hidden parameter is not being recalculated correctly.
The place of the module in the pipeline has also changed through the versions. I seem to recall the original filmic was a transitional module from the scene referred and display referred modules and processes. Darktable’s default has gone to all scene referred modules and processes. The manual says the settings and assumptions have been adjusted, but for me, I still find the module’s curve to be too aggressive at either extremes. Sliders in other modules get twitchy. And make too big of a change in another module that significantly affects exposure or shadows/midtone/highlights balance, things get ugly. Then you either have to tweak filmic not being quite sure how the curve would behave and hope you don’t break it, or resign to starting again at this new scene dynamic range and click “auto tune”.
I note you didn’t touch on “dynamic range mapping”. From memory this used to be more interactive in older versions, I don’t know why there is only ever two zones above 18% being mapped to in “display”.
But, for a while, a lot of Darktable maintainers and people in the community were thinking that he was the bee’s knees. Clarification requests in PRs were brushed off, often implying that the person who asked is just too stupid to get higher math or “color science”. Docs, the docs would be written later of course, don’t ask. And of course code would not be documented, just read the papers.
It is pretty weird trying to rewrite history as if a lone eccentric did all this. To a large extent, yes, but he had to have enablers. It takes two to tango.
Do you mean EVs in the output? That would be because 18% middle grey is log2(0.18) = 2.45 EV below 100% display output.
I like filmic, I think it’s a great tone mapper; I never really experienced the issues you listed, but then most of my edits are rather simplistic. The salmon sunsets aside, I have been rather happy with it.
Yes, it does not differ in the aspects that matter here.
It was not my intention to describe yet alone criticize anyone’s personality. I wanted to criticize technical details, and I was looking for a word that is less strong than “strange” or “weird”.
I find Aurélien’s work both as a photographer and as a coder (and even more in this combination) very impressive.
But then, the technical inconsistencies shown above are a big deal IMHO and a real obstacle to understanding what is going on. As a scientist, I’m used to work with log-log plots, and claiming that something is log-log, when it is not, is just terribly confusing.
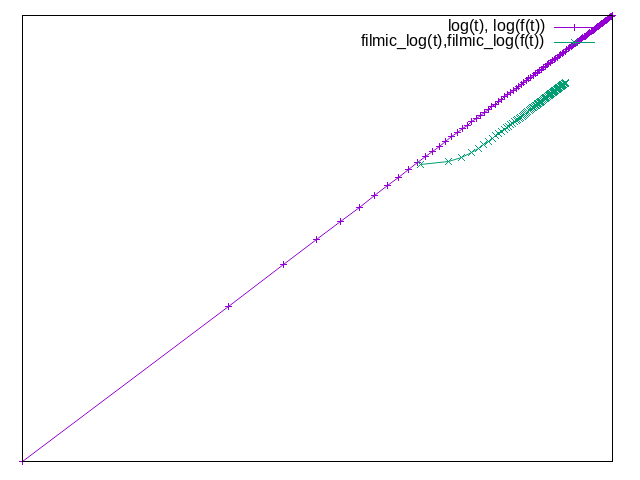
Here is a plot that demonstrates that the difference between a real logarithm and filmic’s “logarithm” is very significant. It shows the function f(x) = x^2 plotted
with real log-log axes (violet),
with filmic’s “log-log” axes (green).
Note how the power function appears as a straight line on a log-log plot. The version with filmic’s axes scaling moreover compresses the left part of the graph very strongly.
set term png
set output "log-vs-filmic_log.png"
unset xtics
unset ytics
set parametric
set trange [0.01:10]
set samples 100

base = 20
filmic_log(x) = log(x * (base - 1) + 1) / log(base)
f(x) = x**2
plot log(t), log(f(t)) w lp, filmic_log(t), filmic_log(f(t)) w lp
One of the reasons I wrote this here is to to see whether other users of Darktable perceive the above points as problematic as well. If this is the case, I might try to clarify the documentation.
I agree that these are problematic, and documenting them would be great. In due course, at least the labels of the sliders etc should be renamed accordingly if clearer terminology can be found.
This is not about the filmic curve (in the sense of the tone mapping function that determines how the image will look), only about how it is displayed in one of the three graphs.
I guess the motivation was to have log-like axes that use less space for the shadows. But I think a real log-log would have worked better. It has the very nice property of representing power laws as straight lines, with the slope corresponding to the power law’s exponent.
Yes, but with this scaling there are lots of boxes in the shadows that are all black and hardly any boxes in highlights. I think the older version of the zone plot was more intuitive where 18% in the display sat in the middle. But I suppose the only plot that really matters is “look only”, which warns you the parameters are causing the toe and shoulder of the spline to invert.
How different is AgX to filmic. There seems some similarity but it feels like from this user’s point of view that AgX solved all the problems I had with filmic. Once again thanks for your work in porting AgX to DT.
Very different: the filmic curve processes a norm and redistributes RGB values keeping the ratios before/after tone mapping the same, except for also trying to manage saturation, taking the export space into account.
AgX is per-channel, and does none of the hue and saturation preservation/management (it can do hue preservation via the look), and, like older filmic versions, has a strong desaturation effect on highlights.
Thanks for the reply. All I know is that AgX works well for me and is easy to learn. Filmic is a challenge at best on a good day and I just don’t need it any more.
This older document is updated in several places… It has history, context, and some math at the end. I’m not sure if it adds much or is mostly in the DR docs but it might be of interest to those that have never seen it… Engineering | Filmic, darktable and the quest of the HDR tone mapping Engineering | Filmic, darktable and the quest of the HDR tone mapping
This information is very valuable for people who try to understand the differences between the tonemappers of Darktable. One could put it into a page that gives an overview of the existing modules, but it might be too technical there (if such a page even exists).
I never understood the motivation for that. And the various norm options, none of which has anything to do with perceptual lightness. I think that filmic is a trainwreck, with advice like
There is no “right” choice for the norm, and the appropriate choice depends strongly on the image to which it is applied. You are advised to experiment and decide for yourself which setting gives the most pleasing result with the fewest artifacts.
The “keep experimenting until it looks right, or at least the least ugly” design is an UI disaster. And calling this color science is a travesty.
It is quite confusing to see 3 tonemappers for people who do not know the history of Darktable.
With AgX and sigmoid, I don’t see any reason to use filmic. I would recommend AgX for most people, even newcomers, as it has sane defaults and you can use a subset. But for someone who does not like to see too many sliders, sigmoid is fine too.