It is possible to use the color space check button (first on the left, at the bottom of the module) to perform a single ΔE computation of the color checker reference against the output of the color calibration module. This can be used in the following ways:
To check the accuracy of a profile calculated in particular conditions against a color checker shot in different conditions.
To evaluate the performance of any color correction performed earlier in the pipe, by setting the color calibration parameters to values that effectively disable it (CAT adaptation to none, everything else set to default), and just use the average ΔE as a performance metric.
My question:
what if i first create a profile and accept it and set it in color calibration module and then press color space check button, (first on the left, at the bottom of the module)? This corresponds to a special case of case 1) above, I thought?
My profile quality report is good, with delta_E avg. 1.76 after optimization with normalization values, but if I press color space check button, then I get “profile quality report:bad”, delta_E=3.64.
I am using release-4.3.0-97-ge5b8eeef7 master branch, Linux Debian, calibrated monitor, and a Datacolor SpyderCheckr 48 post-2018.
The calibration with color checker seem to work well, I am just trying to figure out what color space check button does. However, if this a sign that my profile is very wrong, then something more serious is going on, that I have to fix. This is the first time I use Darktable → color calibration → calibrate with a color checker.
It runs an optimization to try to minimize delta E on top of whatever your input profile can manage. It then creates a set of channelmixer channel adjustments to apply the corrections…
AP has made 2 and maybe 3 videos where he explains and demonstrates it… note the exposure value as well… For the values to be correct the expected exposure is given…
I just followed the video where AP goes through setting up the presets for white balence and colour calibration which work really well for me so not had to do anything since. That was a while a go so can’t remember too much but he goes in depth in that video.
Ya I think he has a video where he introduces it as exptal… Then he does a more indepth one on it and then he reviews it again in his reply to Shane Milton video… One thing that changed from the first version is that initially the exposure value provided was to be added or subtracted from the current value used in the exposure module and at some point it was changed to be the absolute value that you should set it at to have the lowest delta E…
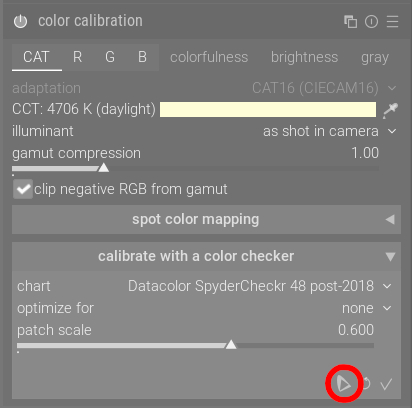
Thank you @priort, @Nathan_Crabtree . I have followed the video and I get a profile with a good fit (profile quality good: delta_E avg. 1.76), but what I wonder is what this button is doing (red ring):
If I try it, just for testing, on the same picture I used when I calibrated from color checker, then I get “profile quality report:bad”, delta_E=3.64.
I have read the manual and it is quoted above in my first post, but I do not get it.
My understanding is that it will test the current profile and not make any adjustments… the second one runs an optimization based on the dropdown and the third ie the check mark applies it…
Not sure it matters or what it means? Just been looking again and mine says bad too when I click it but you don’t touch that to create the preset, it says good when I compute the profile and mine looks fine when combined with the white balance preset that I did. Everything looks accurate colour wise to me and it gives me a good starting point.
I think this is the output value derived for your input profile ie current icc and white balance settings. So its saying without help it not less than the 2.0 delta needed to be in theory hard to tell different from the correct colors. Any activation of compute then gives 3 values for the current mode say neutral… one for the icc one for icc +wb and the third one is for the added channel mixer help provided by the calibration… the display remains the same…hitting the checkmark will apply things and the display updates to reflect the changes… At least this is how I see it…
It’s confused the hell out of me, it says it’s to check the accuracy for a chart shot in different conditions vs your profile so you’d expect the chart shot that I used for the profile to come up as good. Plus it gives totally different normalization values.
 profile checking