Hi everyone,
I wanted to share a new tool I’ve been working on to help analyze darktable performance in real-time. Greetings to @bastibe!
What is it?
The DT Realtime Monitor is a browser-based tool that reads darktable’s log file (darktable -d perf -d pipe >> ~/darktable_log.txt 2>&1) live as you work. It visualizes the processing time of each module, allowing you to instantly see (if) where bottlenecks are occurring.
Key Features:
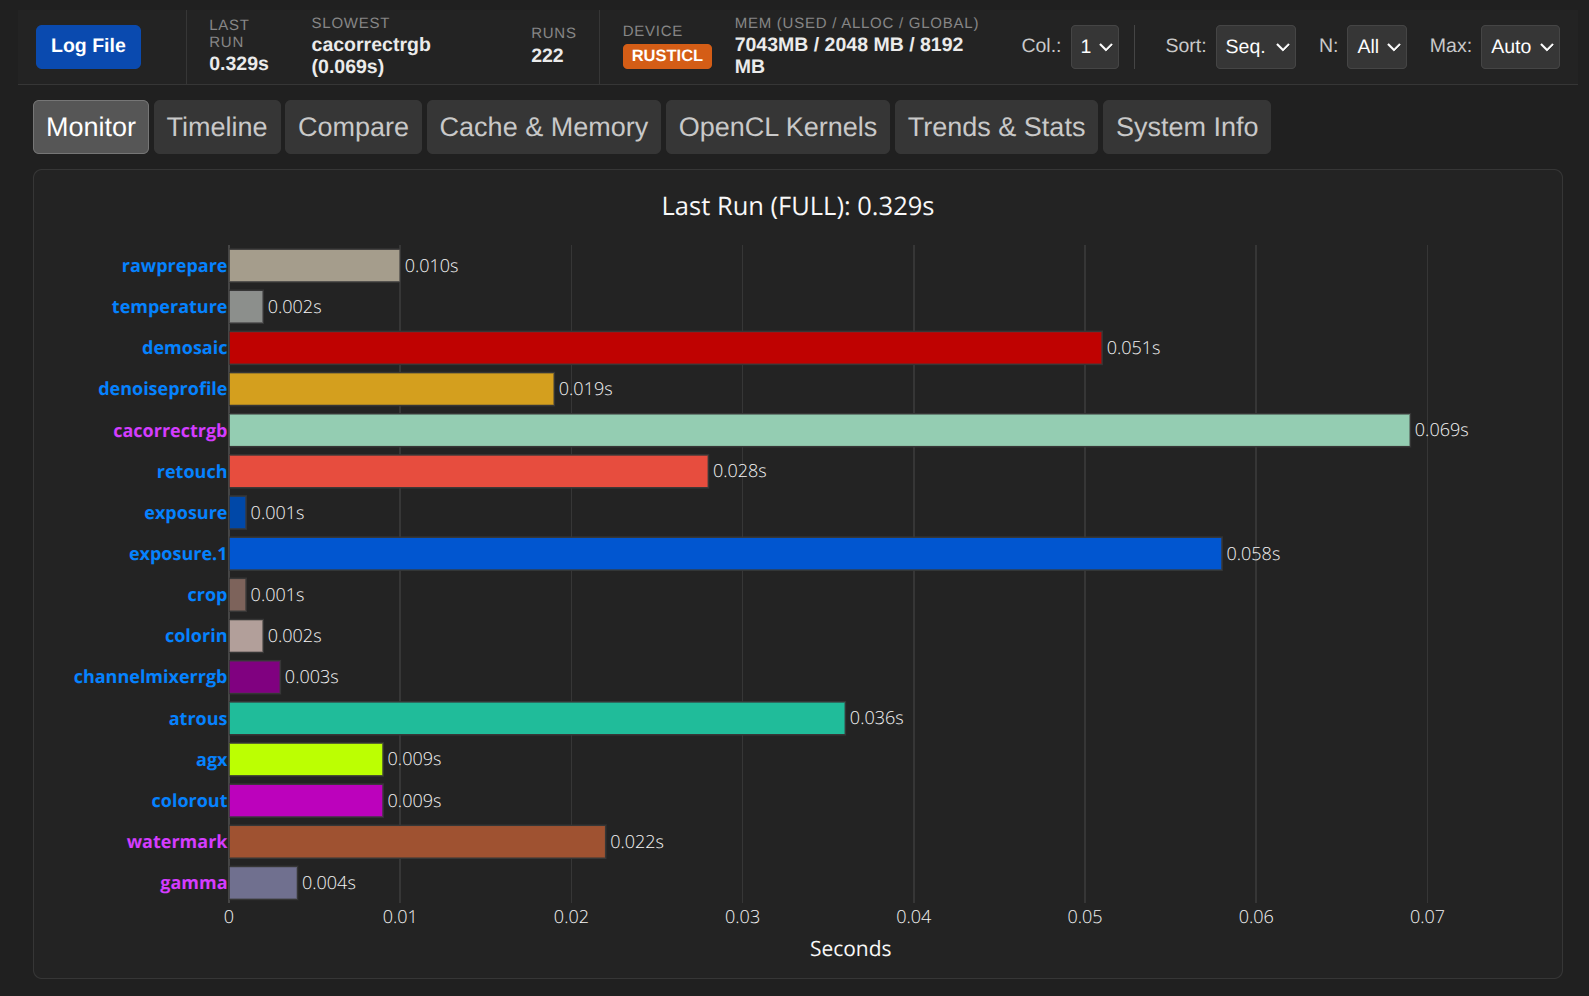
- Live Monitoring: See module execution times update instantly as you edit.
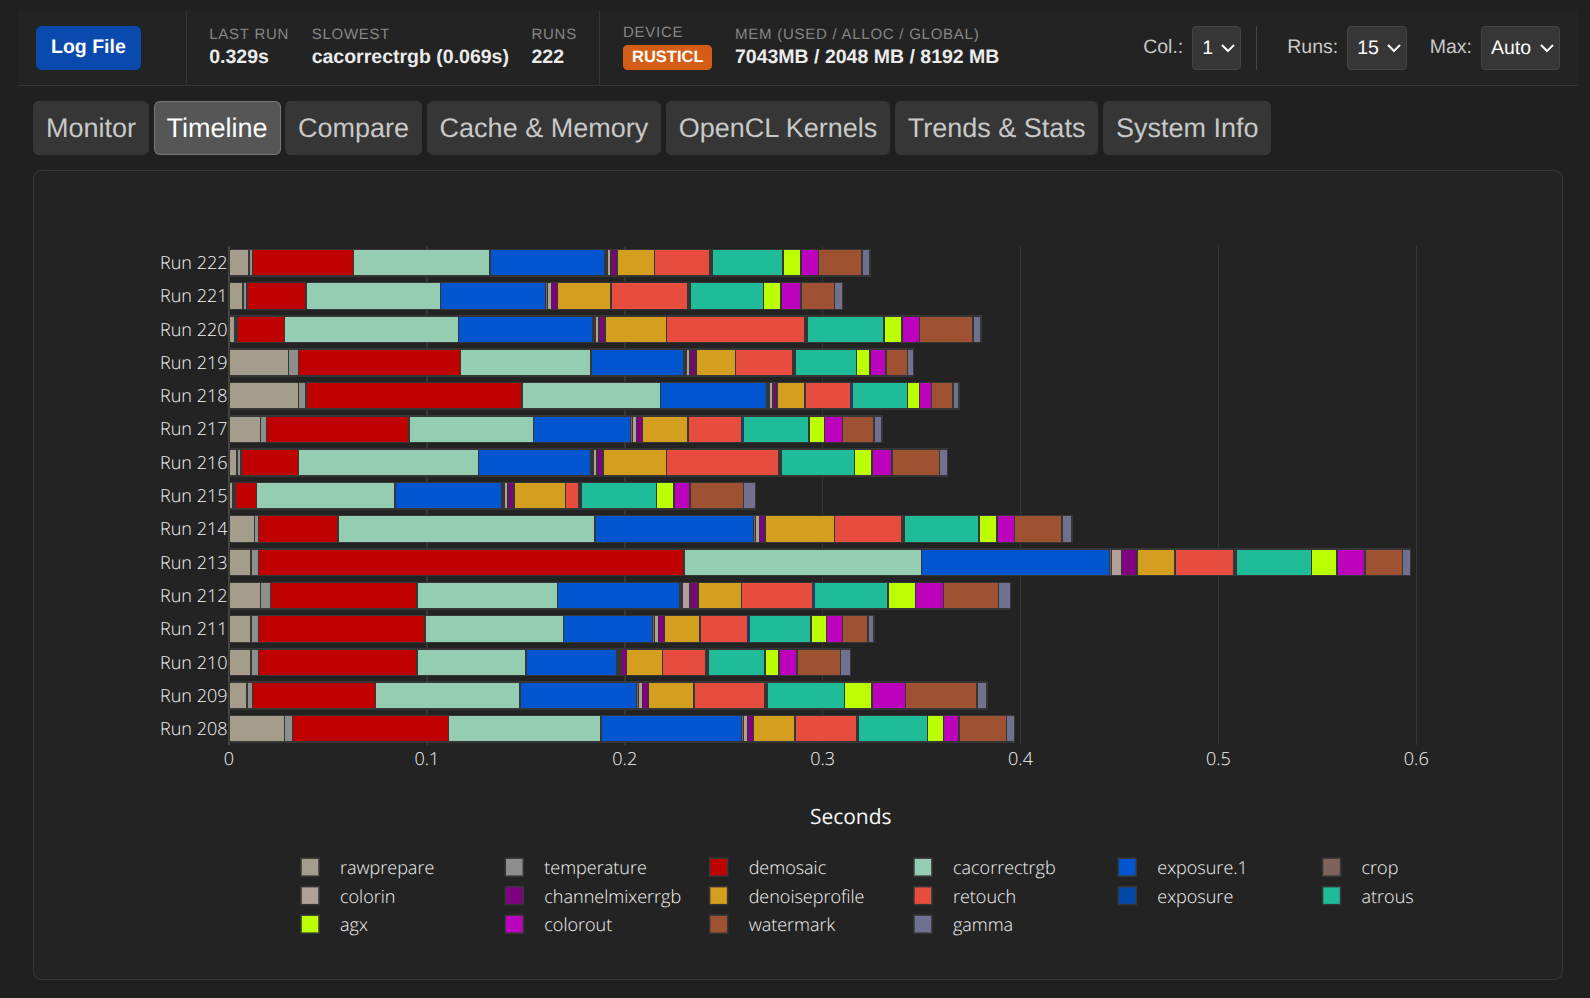
- Timeline View: Visualize the history of your edits to spot trends or spikes.
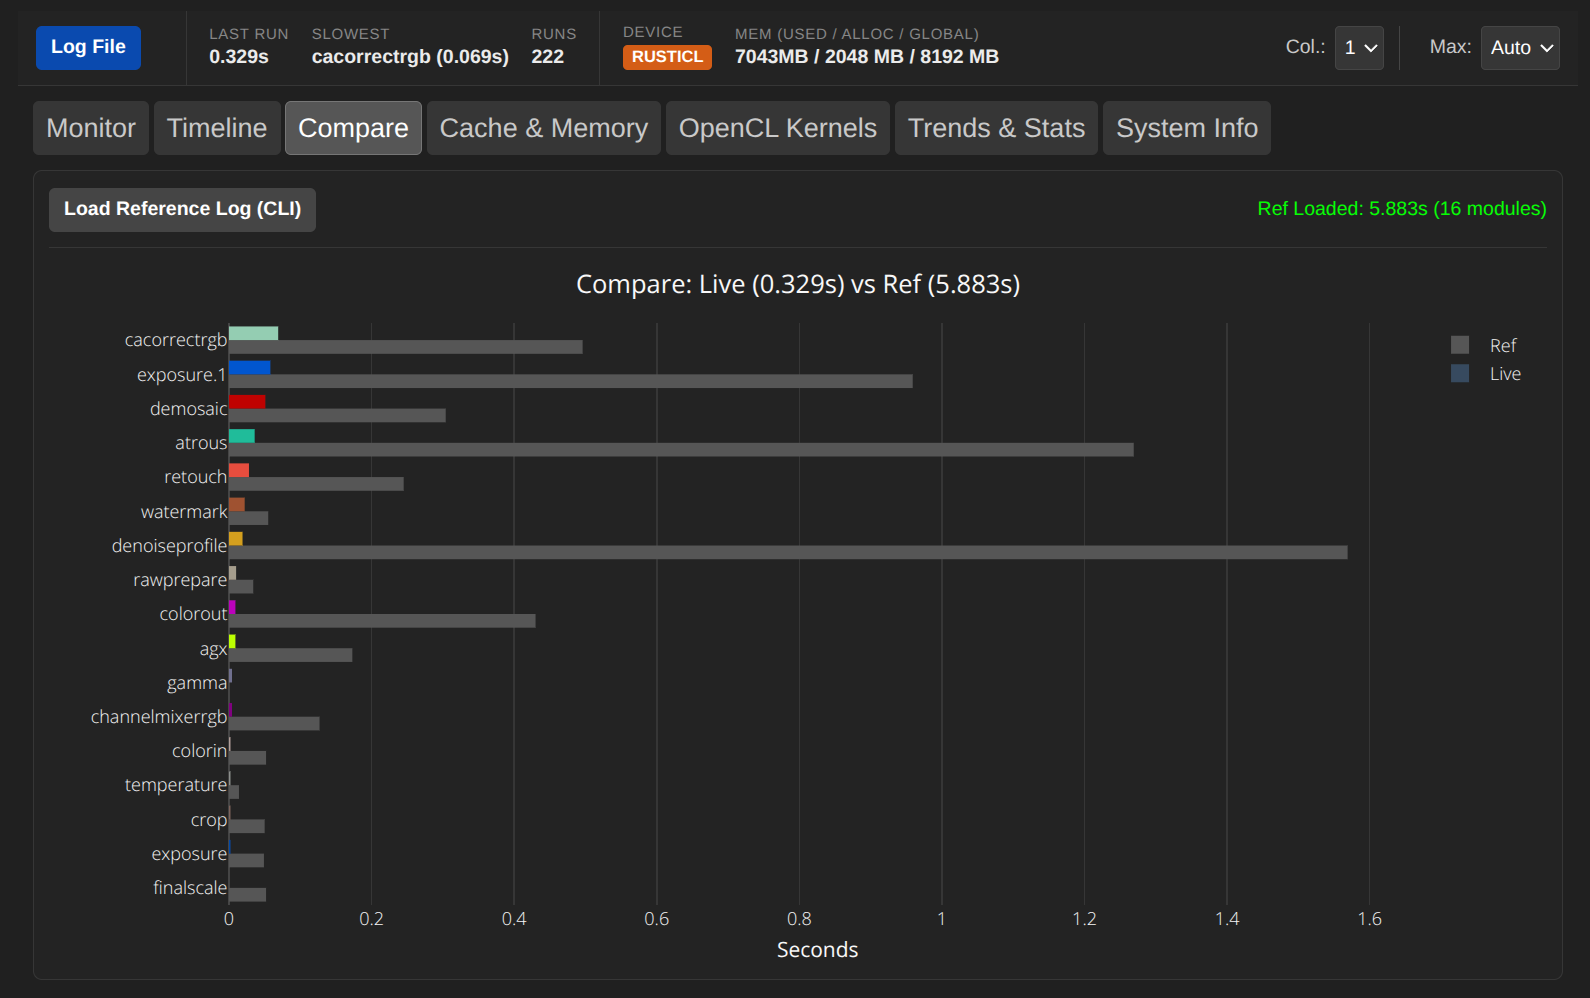
- Compare Mode: Compare your current live run against a export log (Command Builder - darktable.info – Mastering Darktable ).
- Hardware Stats: Displays memory usage and OpenCL device info.
- Universal: Works in Chromium-based browsers (Chrome, Edge, Brave) with live updates. Firefox and Safari are supported via manual log loading.
Links:
- Tool DT Realtime Monitor
- User Manual: DT-RM User Manual
Screenshots:
Main Monitor View:
Timeline View:
Compare Mode (Live vs Reference from darktable-cli export):
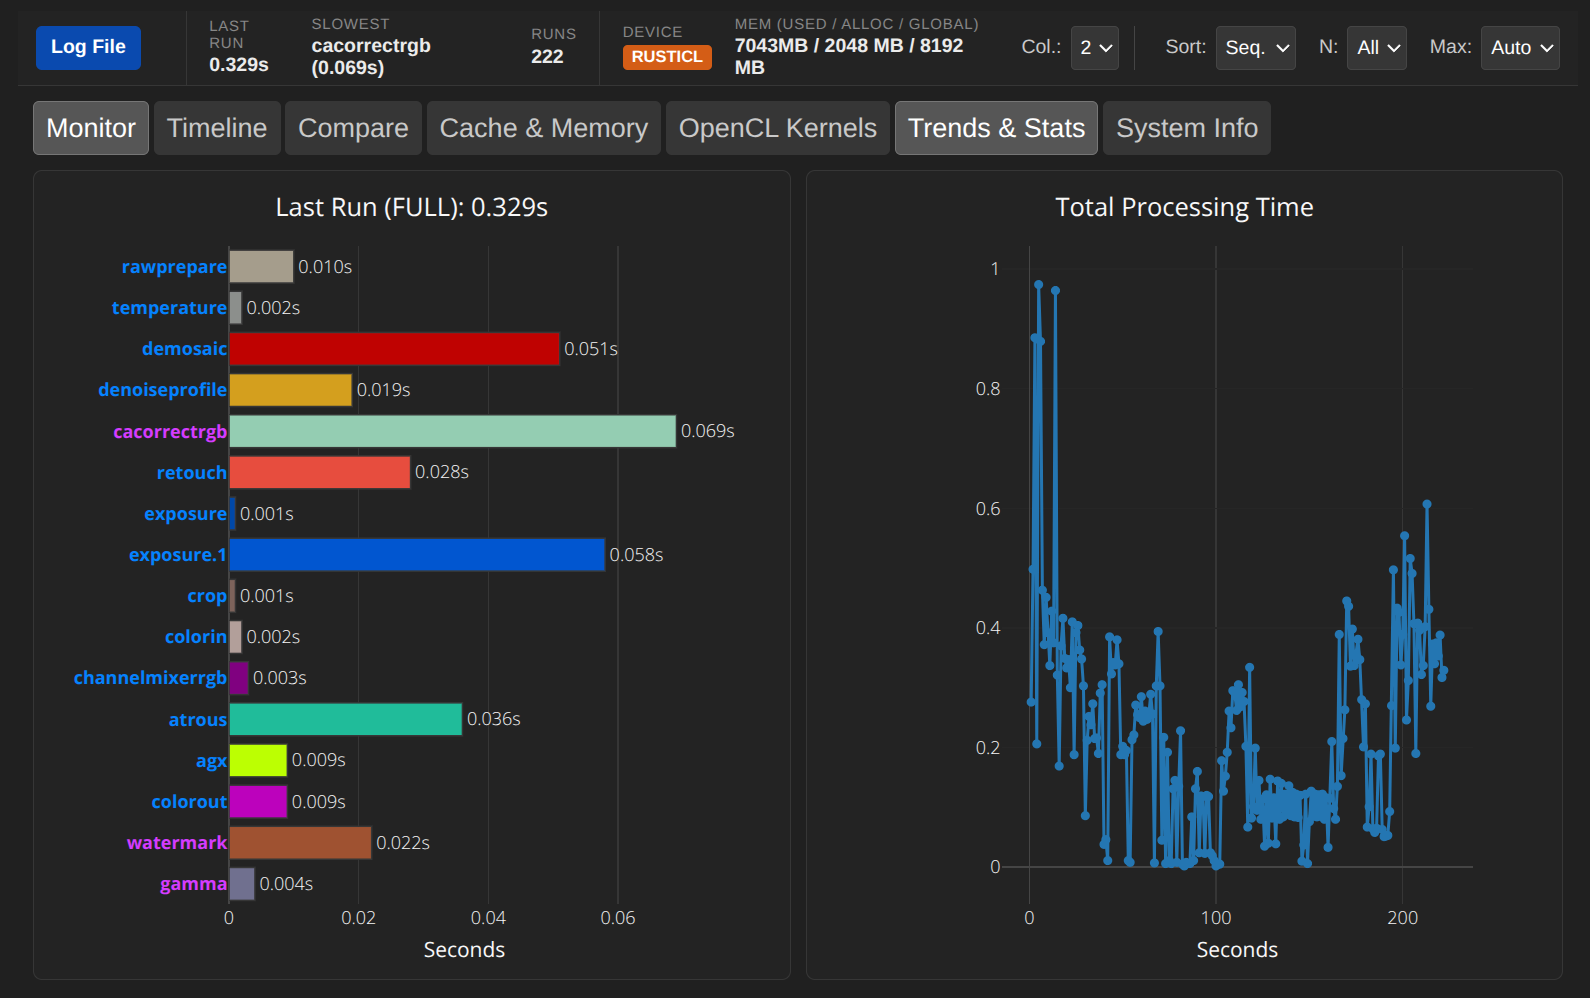
Trends & Stats:
Good to know:
- Privacy: Everything runs locally in your browser. No log data is ever uploaded to a server.
- Offline Use: You can simply save the webpage (Ctrl+S / “Save Page As…”) to your computer and use the tool offline anytime.
I hope this helps anyone looking to optimize their Darktable configuration or debug performance issues!
Chris