The information and examples on this page refer to exporting photos at maximum resolution. Since editing within darktable (DT) generally requires fewer resources, exporting represents the most demanding scenario, which is ideal for analyzing performance.
We follow the same approach as described in the manual:
how to test
In order to determine how much your modifications improve (or not) darktable’s performance, you will need one or more sample images to test with, and a method of assessing the speed of the pixelpipe.
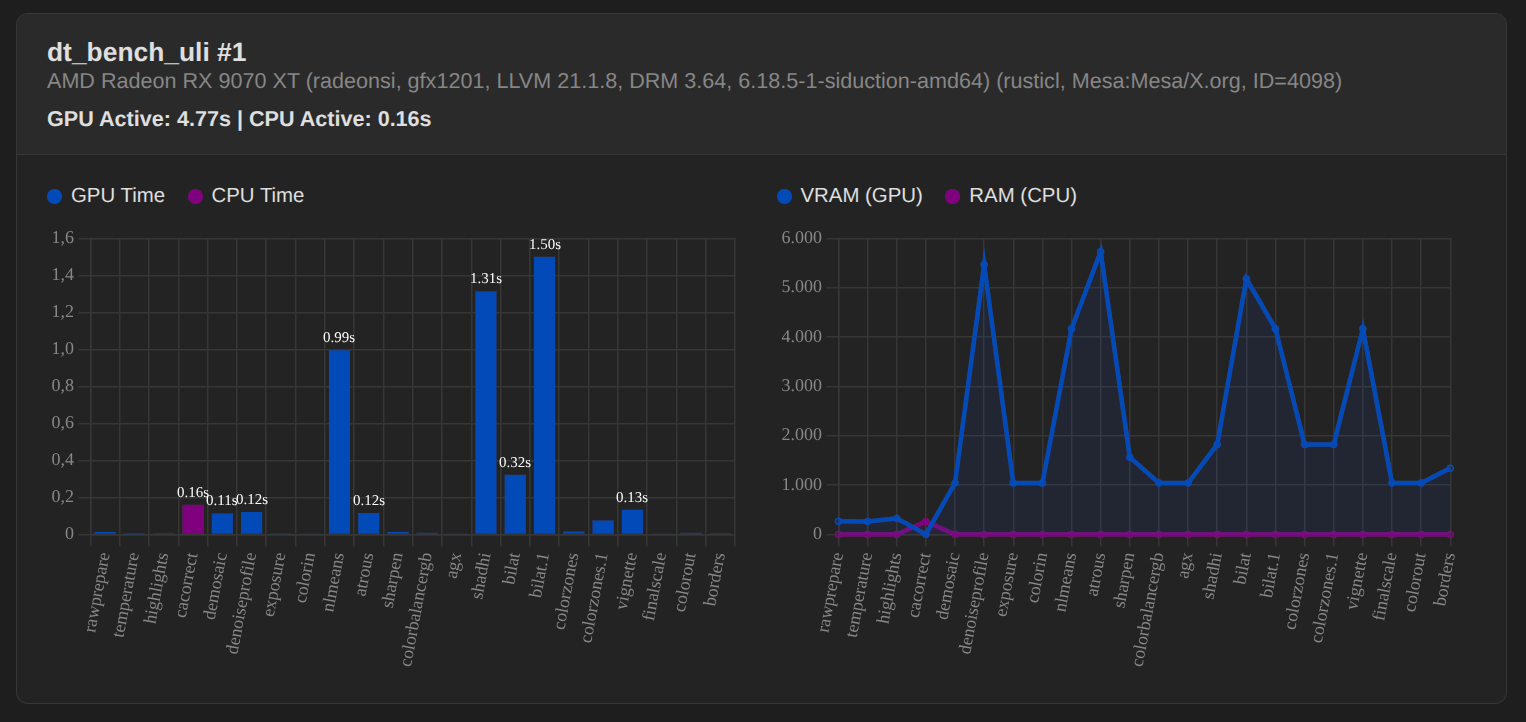
For sample images, you are advised to use some of the more intensive modules, such as diffuse or sharpen or denoise (profiled). Exports are likely to have more consistent and comparable timings between pipe runs than interactive work (and will also push your hardware more).
In order to obtain profiling information you need to start darktable from a terminal with darktable -d opencl -d perf. If you want more information about tiling you should use darktable -d opencl -d tiling -d perf.
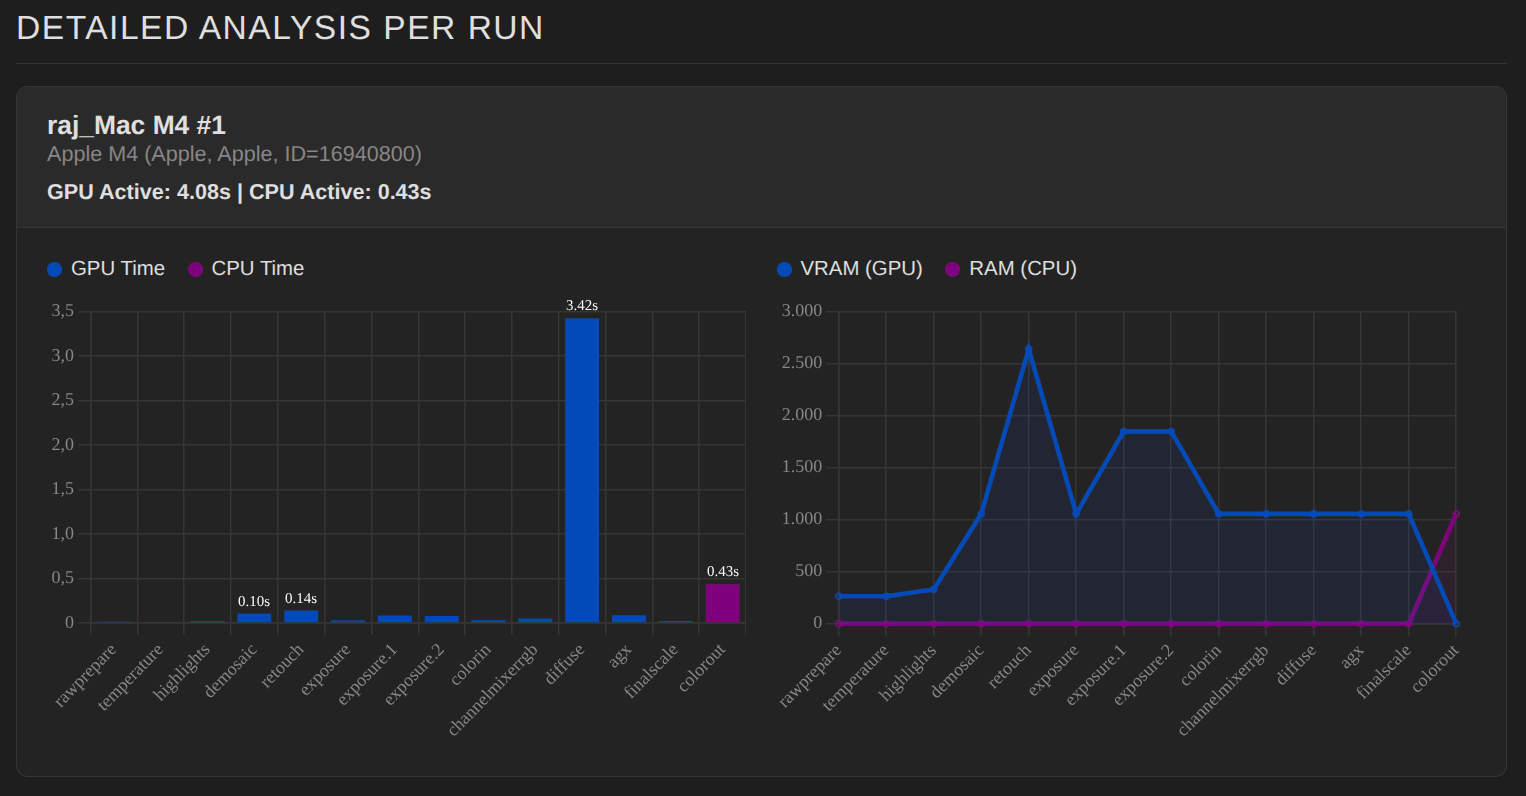
Each time the pixelpipe is processed (when you change module parameters, zoom, pan, export etc.) you will see (in your terminal session) the total time spent in the pixelpipe and the time spent in each of the OpenCL kernels. The most reliable value is the total time spent the in pixelpipe and you should use this to assess your changes.
So we assume that exporting is a worst-case scenario. Is there an alternative way to measure performance “in” darktable?
Sort of. If you wiggle a slider very early in the pixelpipe, such as demosaicing sharpening. Then you get performance measurements for the full pixelpipe (as opposed to the export pipe or the preview pipe).
But it’s difficult. Without information about the XMP and Darktable’s settings (window size, screen resolution, color assessment, sampling modes…), these measurements won’t be comparable.
I’d recommend providing a “standardized” raw and xmp, and have everybody render that on their computer.
My understanding is that @Qor’s tool is not meant for cross-system analysis, but rather to answer the question “where is time processing this image spent?”, or “why this image processes quickly, why for this one it takes forever?”.
In this case one is comparing against it’s own setup. One can use the tool to understand where the bottlenecks are, or try different settings and see where the situation gets better or worse.
Edit; on the other hand, this suggests otherwise, so maybe you are actually right.
Yes, exactly, that is the current status of our idea.
That’s not entirely wrong either. We started out with the idea of creating a benchmark (including downloads for xmp + raw). Over time, however, it became clear that it is more interesting to understand how your own system works and where problems can arise.
There are several causes for this, which we will discuss in more detail over time on darktable.info
Currently, we simply need logs, regardless of which RAW and which modules are used, to ensure that parsing works smoothly.
It was unavailable for a while. After installing intel-opencl package, I can activate it, but it seems to freeze/crash darktable. I havent worried much about it so far, since the performance gain with an older intel iGPU would be very small to unnoticeable.
When I load the log file in your web viewer it is not generating any graphs. What is wrong ? Is OpenCL working in my machine? Is the openCL preference OK? dt-bench.txt (13.8 KB)
Some comments from my side but first, a very nice idea to do a graphical representation tool from the logs!
Somewhat hard to read colorwise.
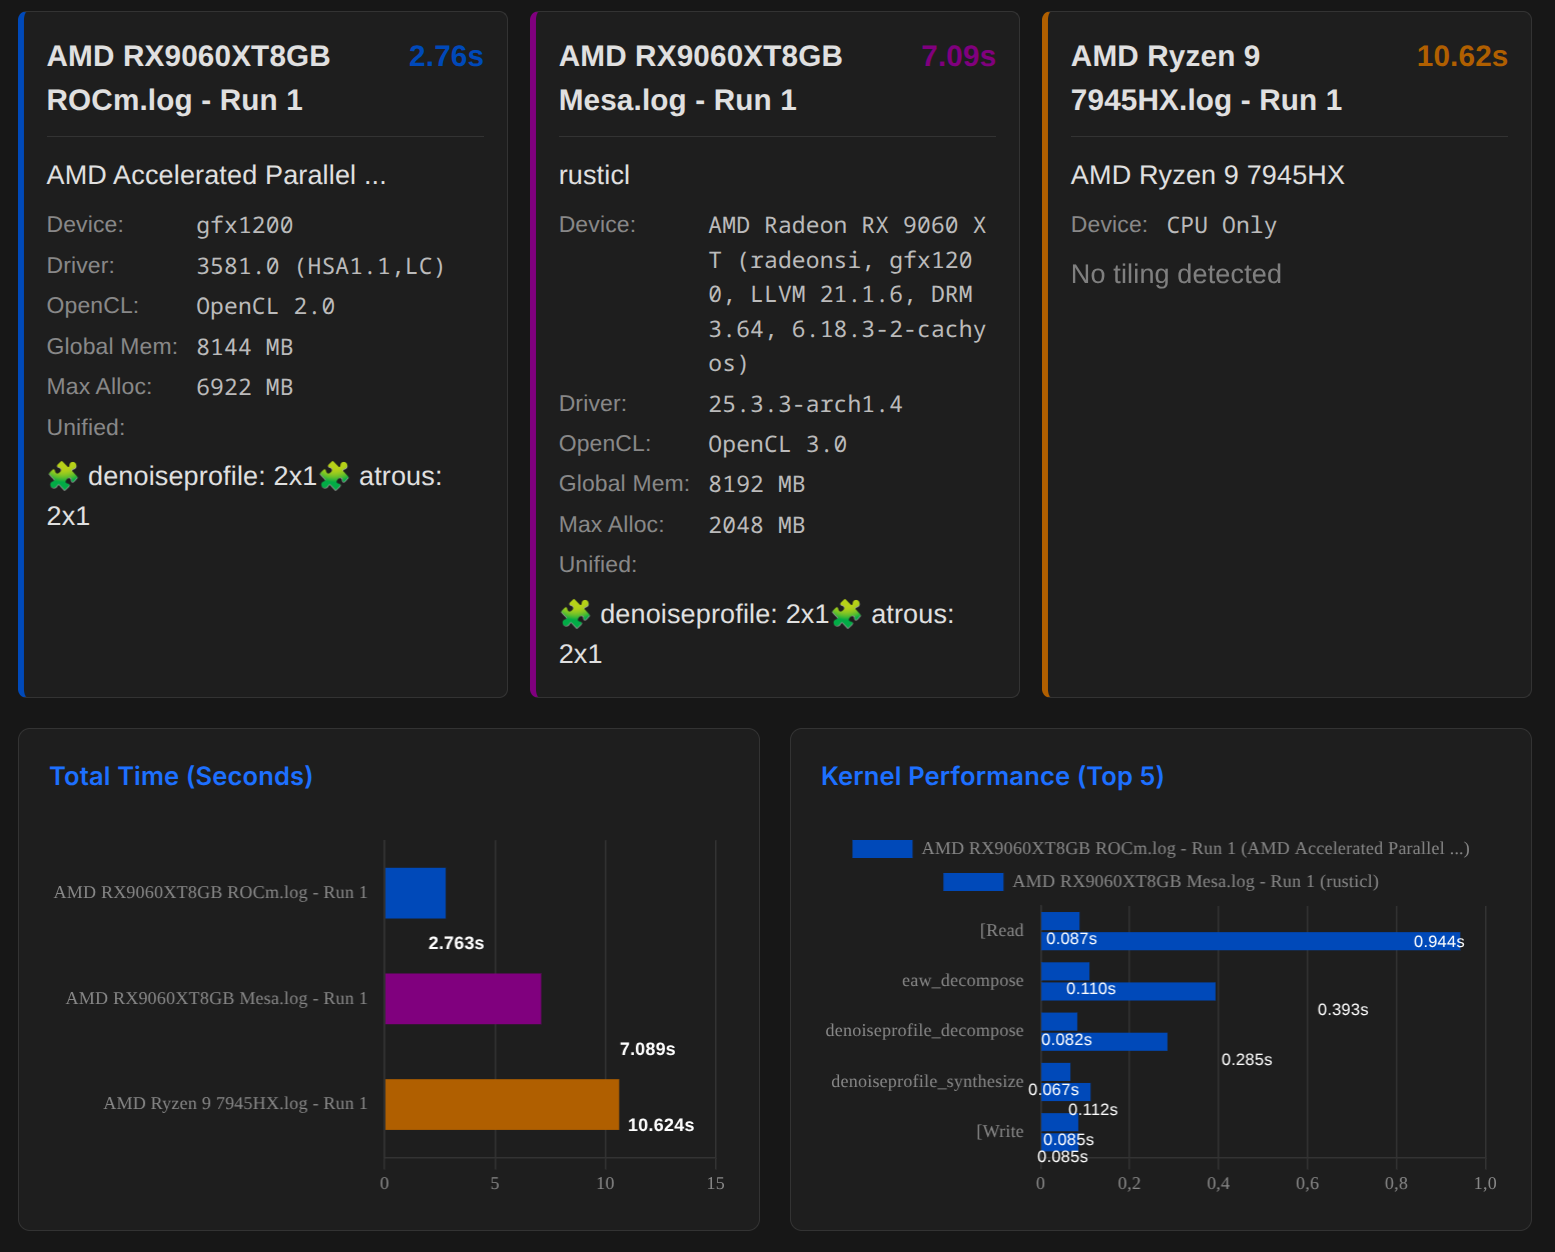
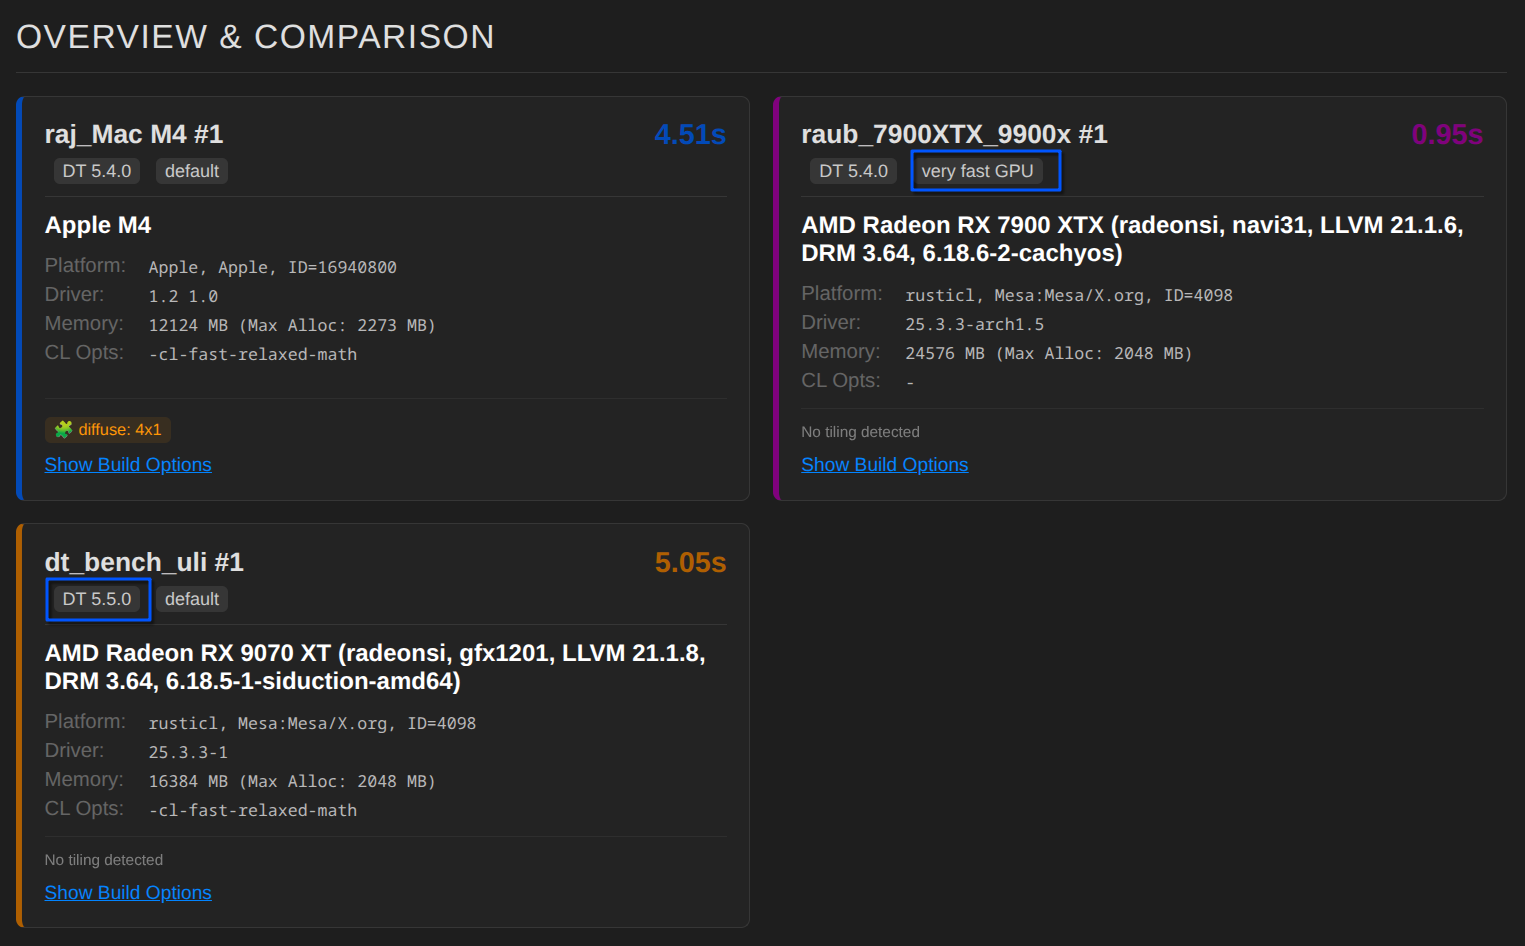
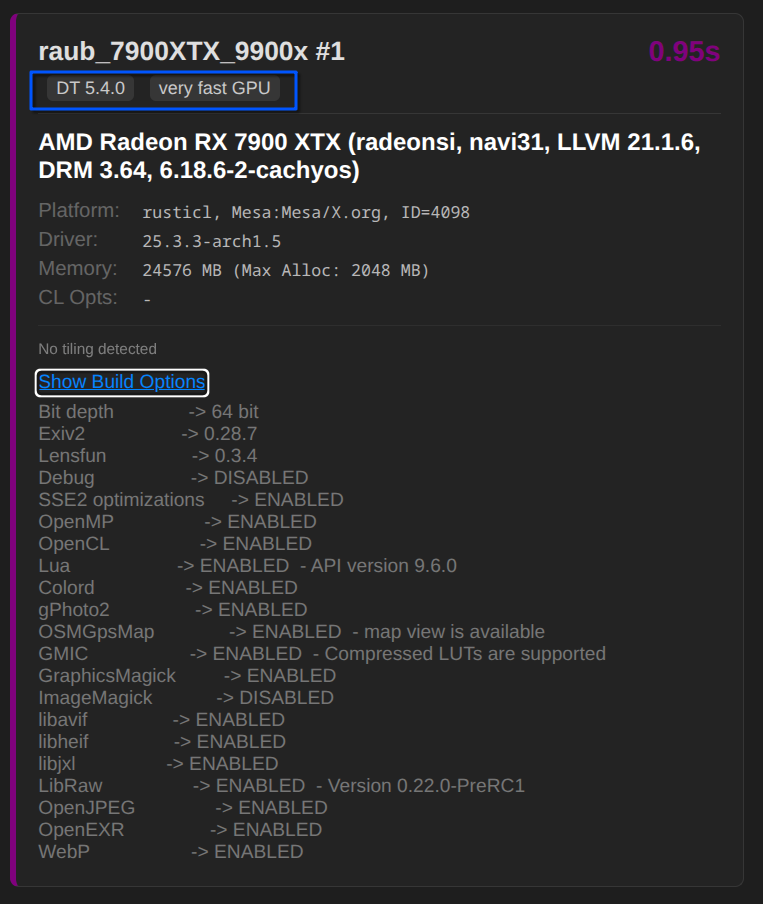
You show “Max alloc” prominently, i think that is misleading as not relevant for dt OpenCL at all on all current CL devices
The performance level is clearly missing as that defines “what amount of memory will dt take”. (There will soon be better information via logs …)
We constantly improve performance in dt code, so a) dt version and b) the compiler option would be important. The dt rusticl backend got significant gain here lately
You asked about “how to measure OpenCL performance”. Please note we have our manual, you could use --conf resourcelevel="reference" if you want to compare.
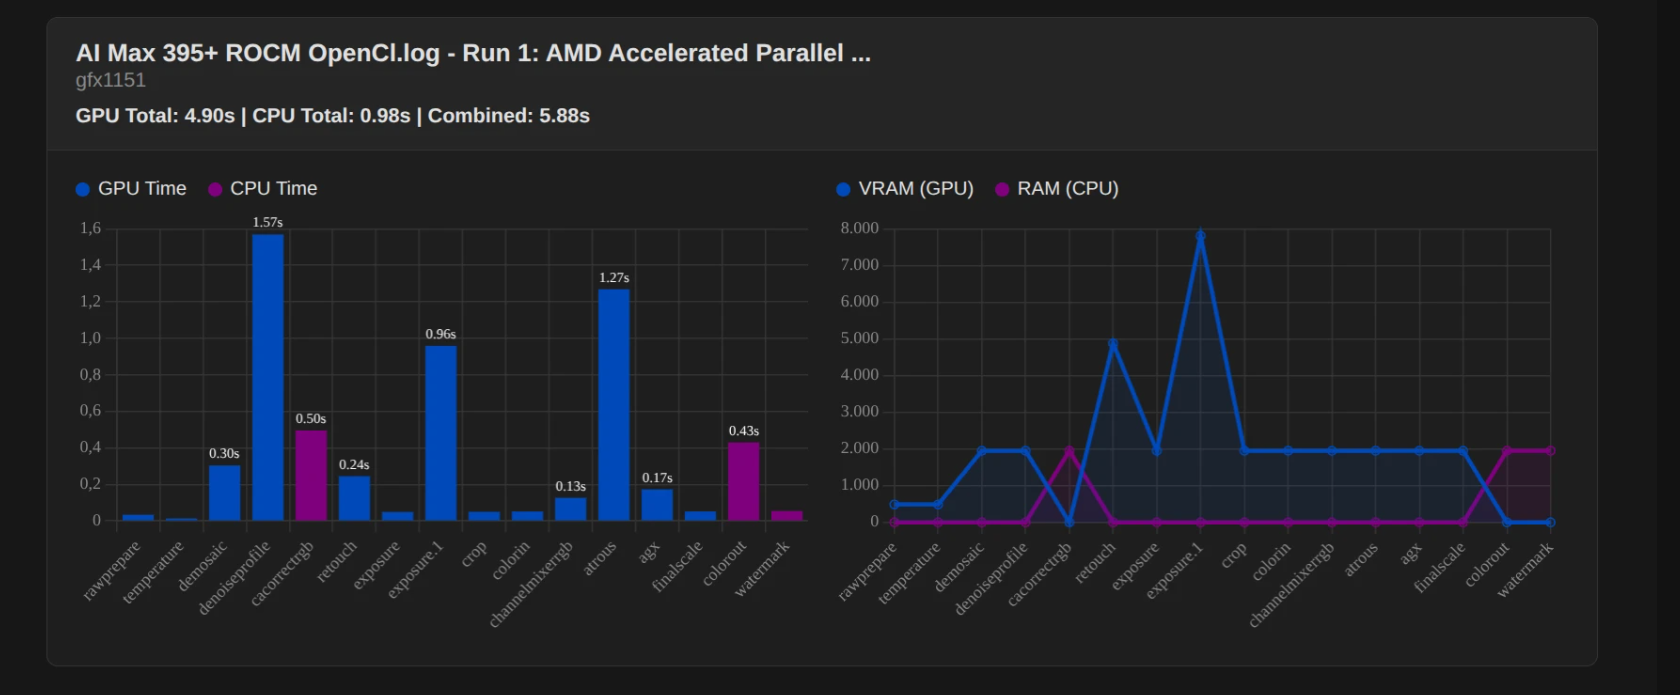
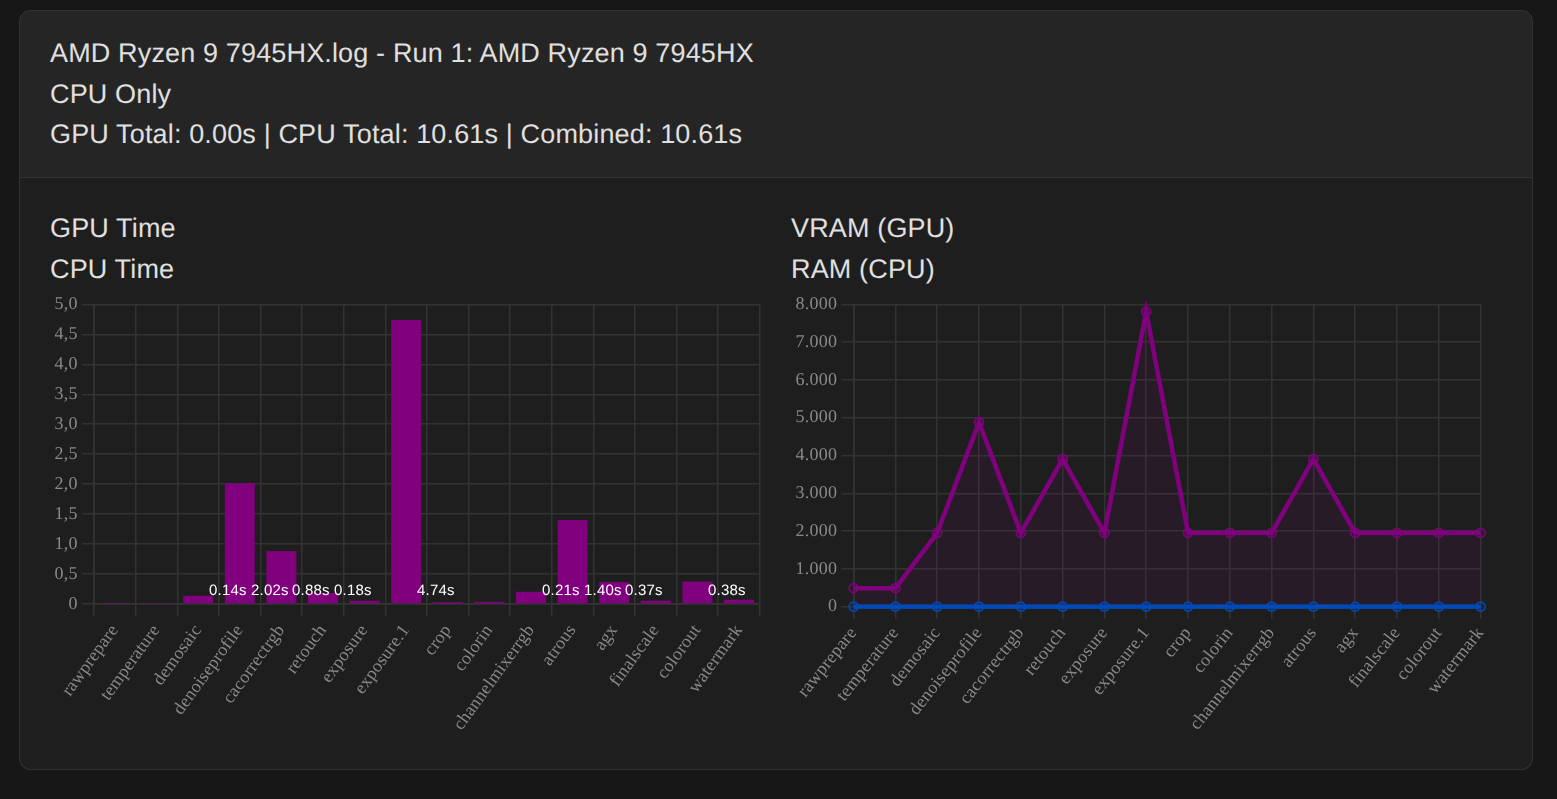
I looked at your StrixHalo test, i can compare as i have one myself
You say The biggest bottleneck for performance is not a slow GPU, but rather the **unnecessary transfer** of data **between the GPU and CPU**
From my tests and perf logs this is absolutely not the bottleneck except when very hard tiling like on 2GB cards.
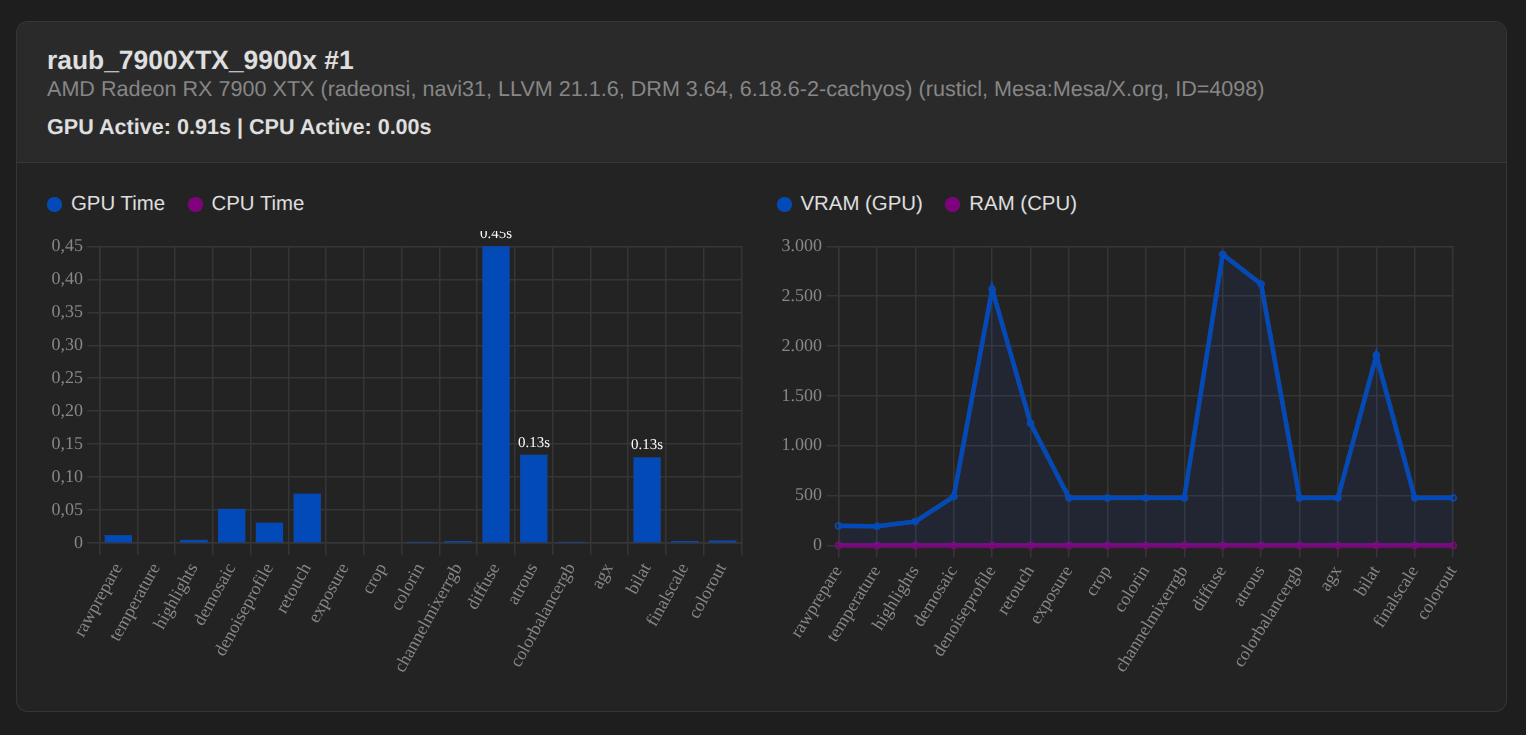
I think your analysis about tiling being the culprit is somewhat wrong. Sure - there is a penalty but that will only be a bottleneck if the overlap is large compared to tilesize. (You could analyse tile vs roi size here). You demonstrate that more tiling still leads to better performance for denoiseprofile for example.
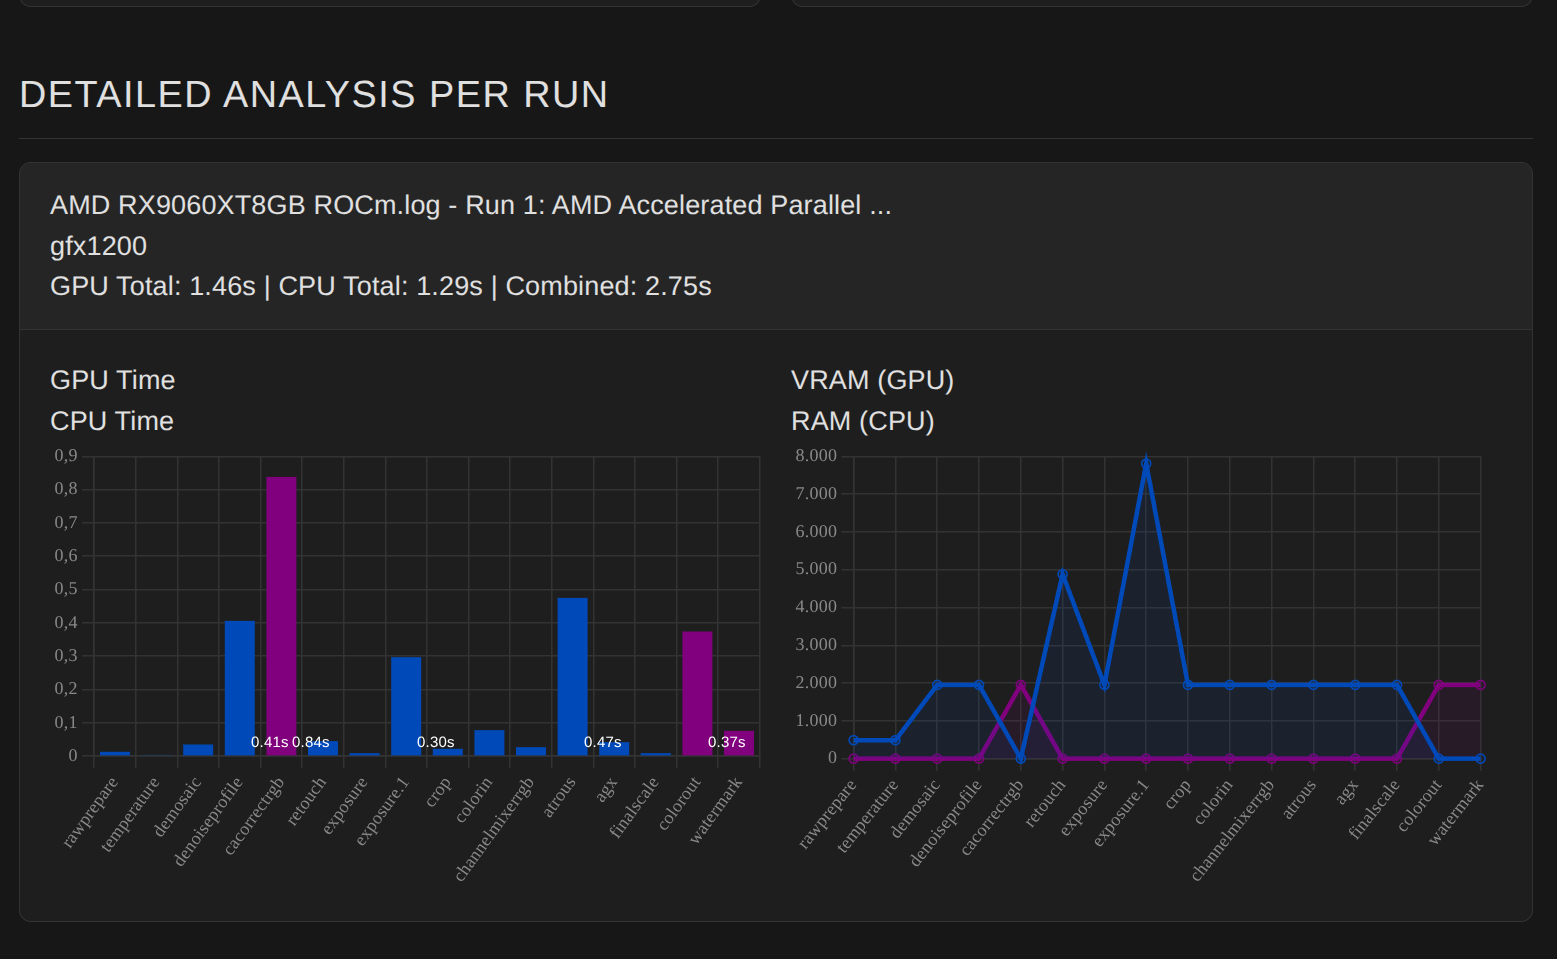
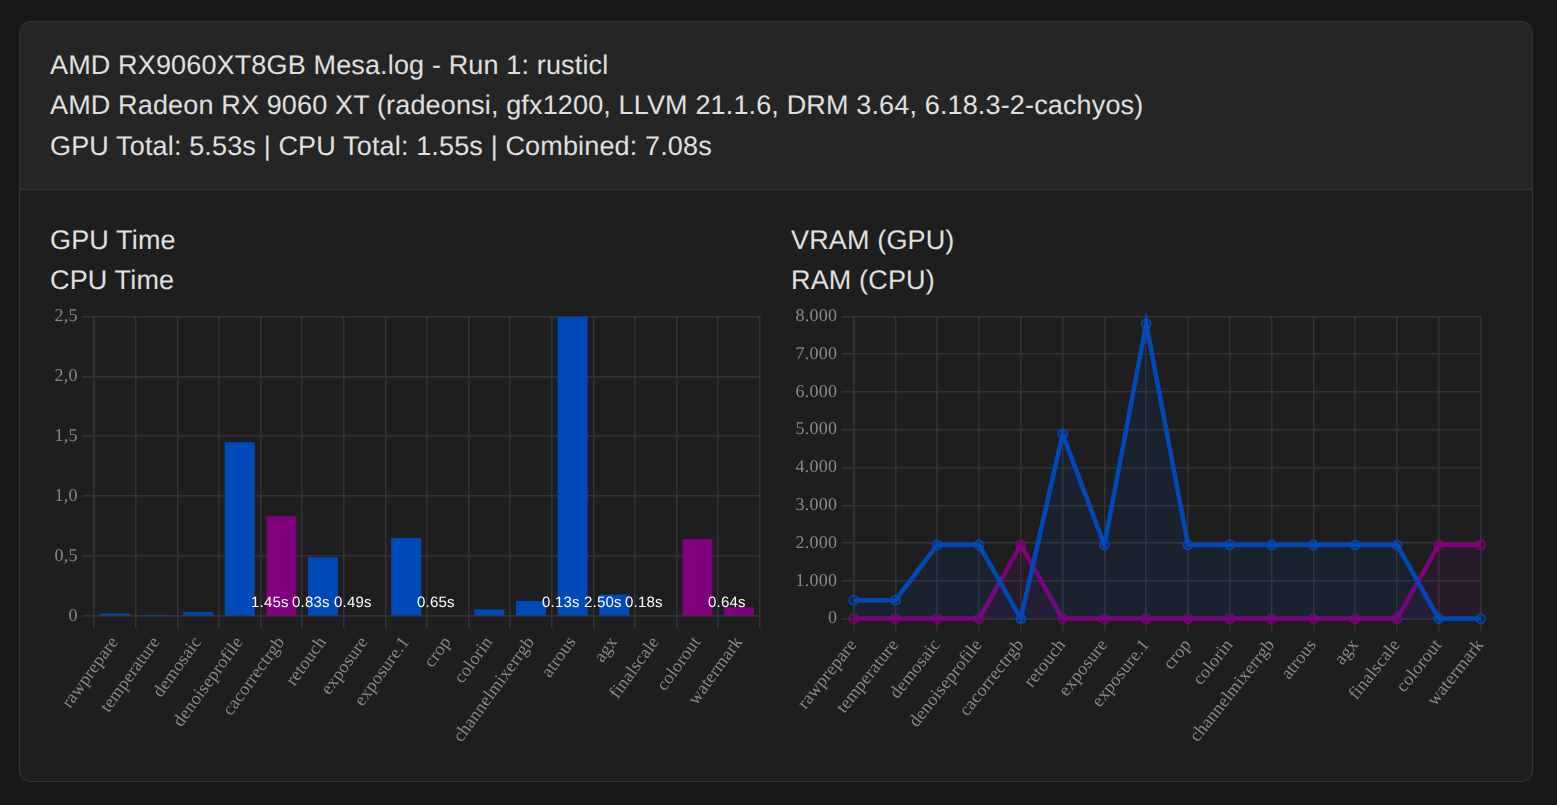
Instead of comparing ROCm vs rustcl you compare a 13GB card with a 4GB card thus rusticl has to tile more, relevant for atrous.
There is one specific aspect i found very interesting (me being the pixelpipe guy in dt devs) and i would like to investigate in depth. The result depends mainly on results in exposure1. Your rusticl seems to tile here with 1x1, this can only be due to some blending / mask handling stuff as exposure itself is sane. Would you be able to share xmp and raw file?
( a techy note: masks distortions don’t use OpenCL yet)
Thank you for the log. The fact that you cannot see anything is due to our script; there are problems with parsing. It is precisely these logs that help us to improve the tool.
Thank you very much too. I have the same problem as in my comment above yours.