@hannoschwalm is it possible/easy to make the CLI output json? That’d make this much easier.
By the way, here is the file I currently (always) use. So if you would like to send me another log, I would be delighted to receive it.
log_2026-01-20.txt (12.7 KB)
1 Like
Thanks for file and xmp, indeed it’s the blending in exposure1 doing very heavy feathering. I tested it here on StrixHalo with lots of OpenCL mem so no tiling at all using your options plus -d pipe and see
    33.3873 process                   CL0 [export]         exposure.1             2600       (0/0)  9567x6375 sc=1.000; IOP_CS_RGB 7806.7MB
    33.4615 blend with form           CL0 [export]         exposure.1             2600       (0/0)  9567x6375 sc=1.000; IOP_CS_RGB, BLEND_CS_RGB_SCENE
    34.0492 [dev_pixelpipe] took 0.662 secs (0.252 CPU) [export] processed `exposure.1' on GPU, blended on GPU
so all is happening in input after blur and overall timing is
34.9532 [dev_process_export] pixel pipeline processing took 3.222 secs (8.279 CPU)
I will see if we can do some about the feathering code but most important, if you configure your system correctly it will be much faster or in other words: “you measure what and how you measure”
Edit: BTW no unified memory here ![]()
1 Like
I meant the preference setting darktable resources
1 Like
Absolutely no idea ![]() Have never used that so far
Have never used that so far
1 Like
log-1.txt (17,9 KB)
1 Like
Thank you!
With pleasure.
Good to know
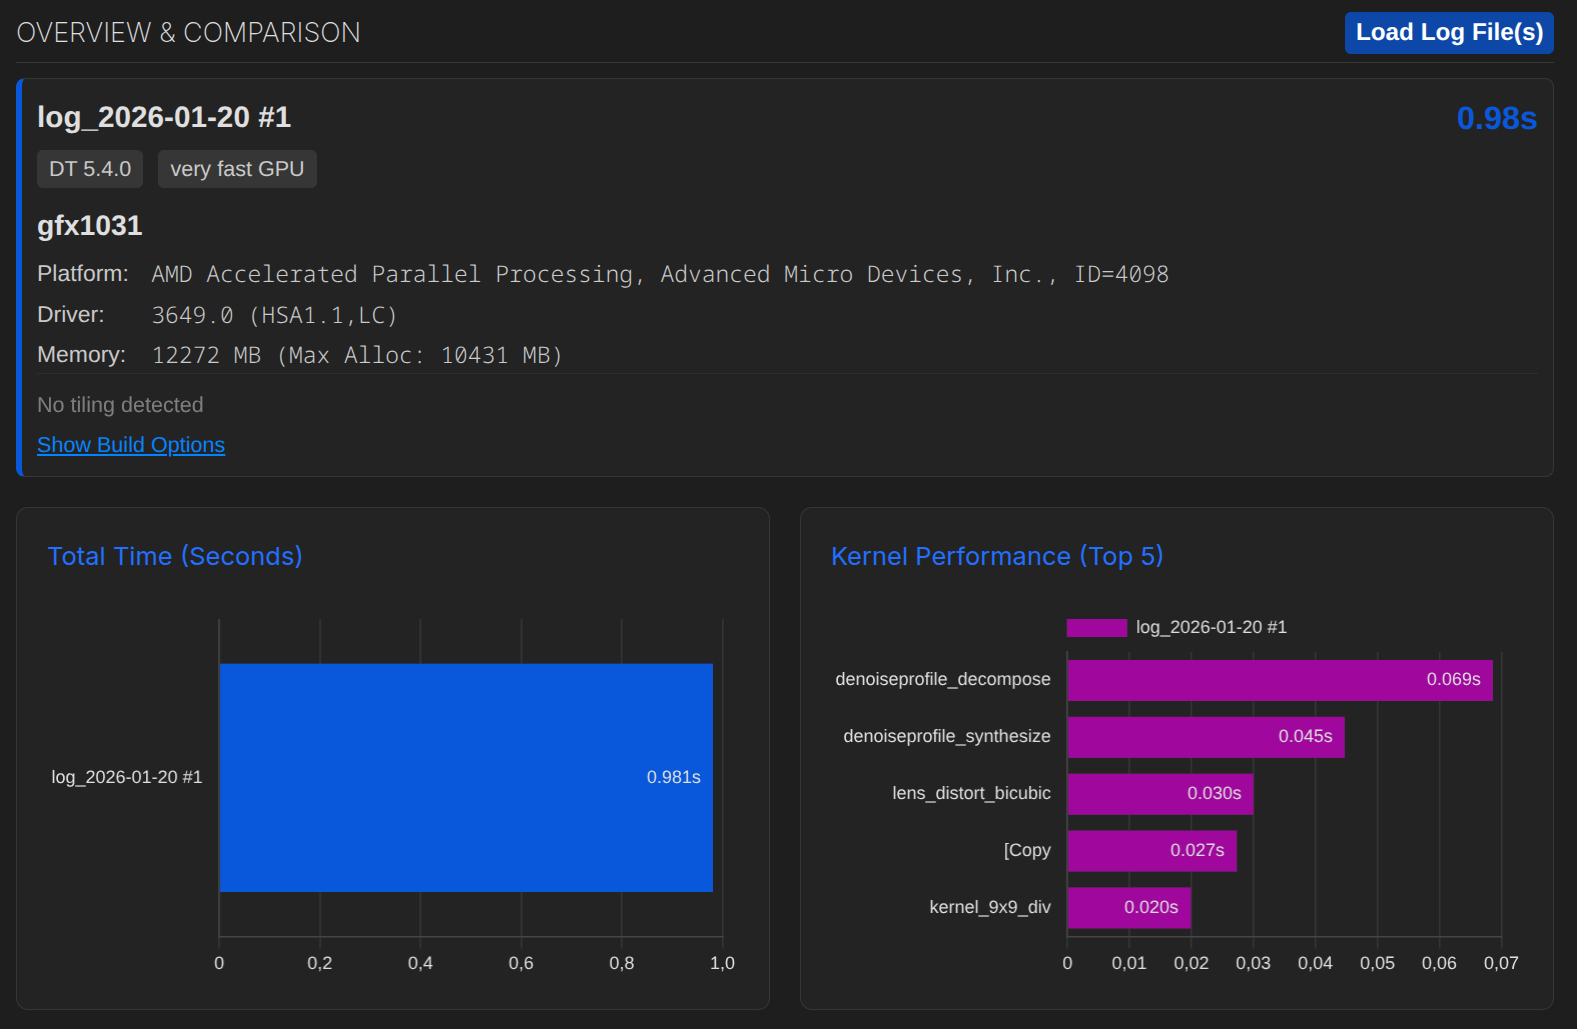
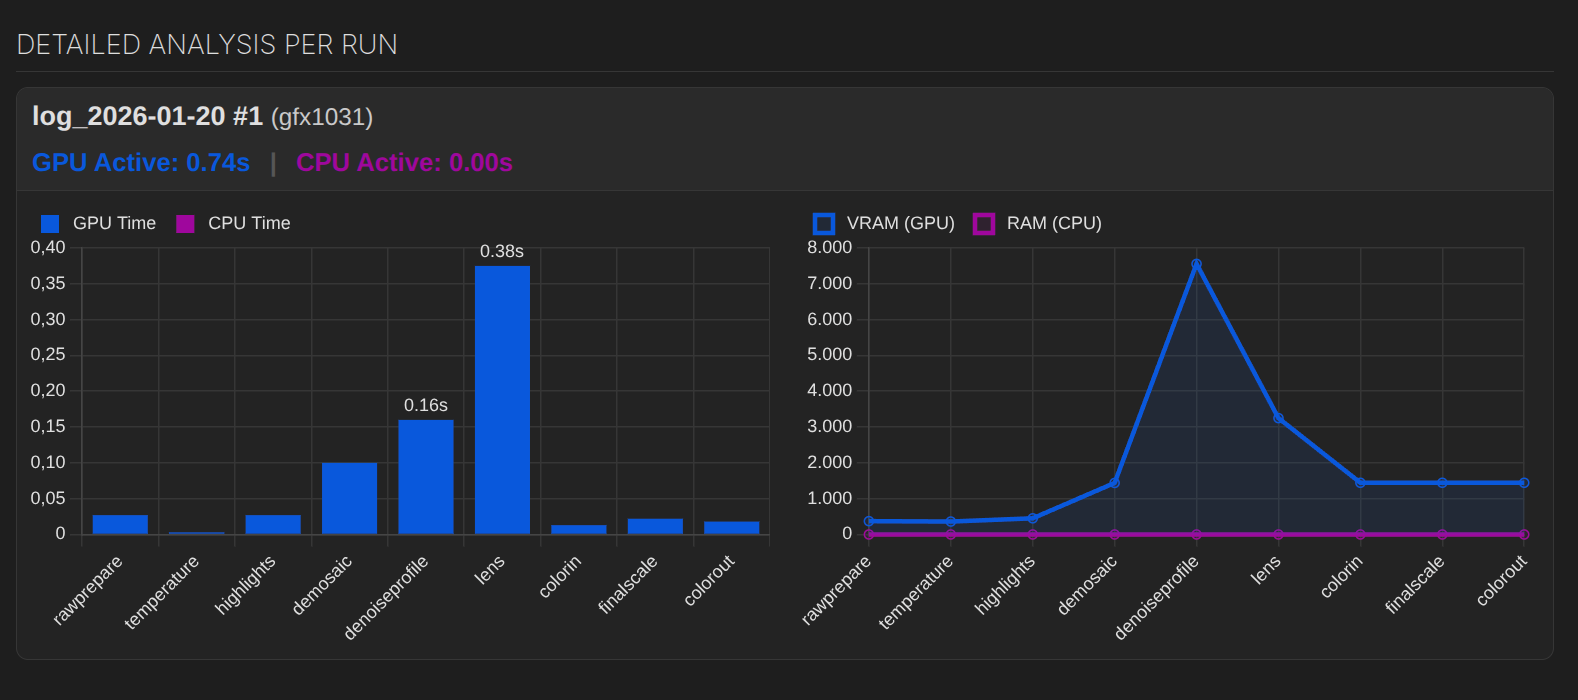
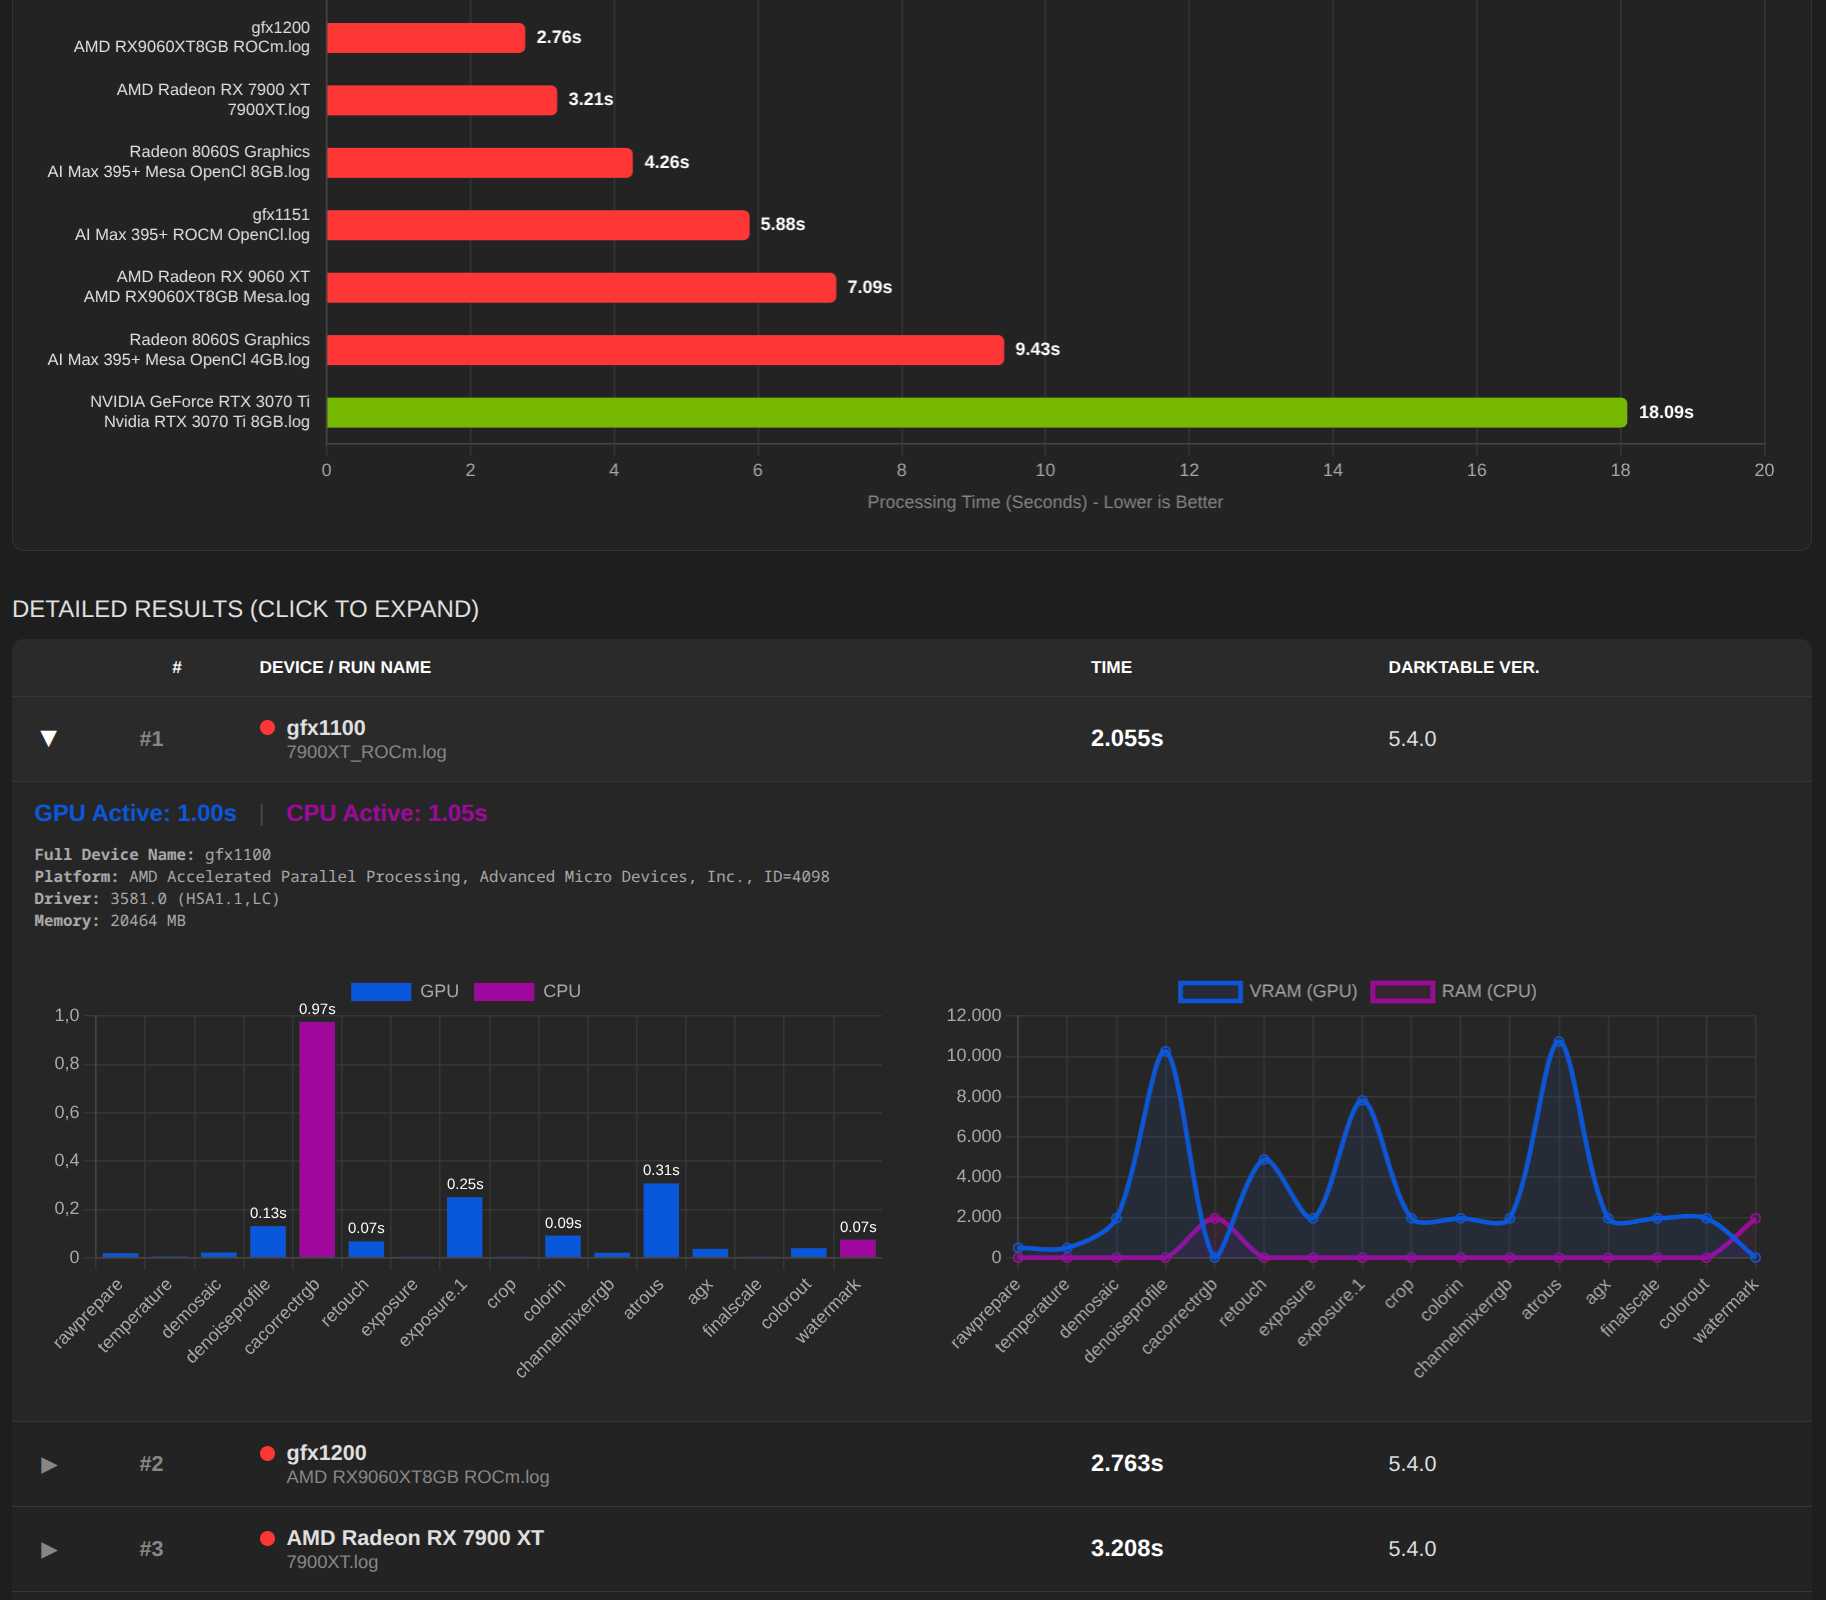
In the graph, it looks like a “big” outlier, but when you look at the actual time, it can’t be a big problem.
As you say, if the system is configured correctly, there is no problem. The tool is designed to help by providing a quick overview and/or comparison.
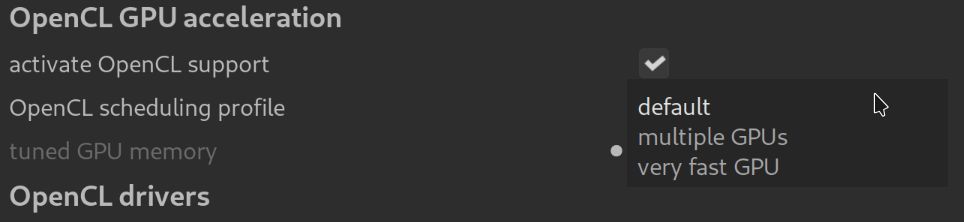
Do you mean tuned GPU memory (which is not available to me)? Or the scheduling profile? Or something else…
Interesting, I thought all Strix Halo devices used unified memory. What are you using?
I have adjusted the colours of the graphics and fonts again. If anything is still missing, just let me know.
Best regards, Chris
log.txt (16.5 KB)
This is fairly recent.
1 Like
Thank you very much.
The OpenCL memory darktable is allowed to take from all. That’s defined by darktable resources setting in UI preferences and fully covered in the manual.
Nope. Of course the memory is shared! but unified memory in OpenCL context is something different, btw -d opencl will show you at the beginning what type of memory is presented.
1 Like
Ich habe mit einer Benchmark Seite (mit ein paar Beispieldaten) angefangen. Gibt noch ein paar Bugs, aber schau einfach mal rein:
1 Like
dt-bench.txt (19.0 KB)
1 Like
Apple M2 Max:
log.txt (15.3 KB)
1 Like
@dirksagwitz @bastibe Many thanks to both of you!
And an oddball: Snapdragon X-85 (ARM64/Windows)
log.txt (13.8 KB)
1 Like
Now that’s what I call exotic, very cool. Thank you!
I have a question about this. The logs show that OpenCl is present, but I assume it cannot be activated?
It can be activated, but will crash in interactive use.
Edit: but it appears the benchmark runs fine:
log2.txt (19.6 KB)