L*a*b* Adjustments - histograms

Hi,
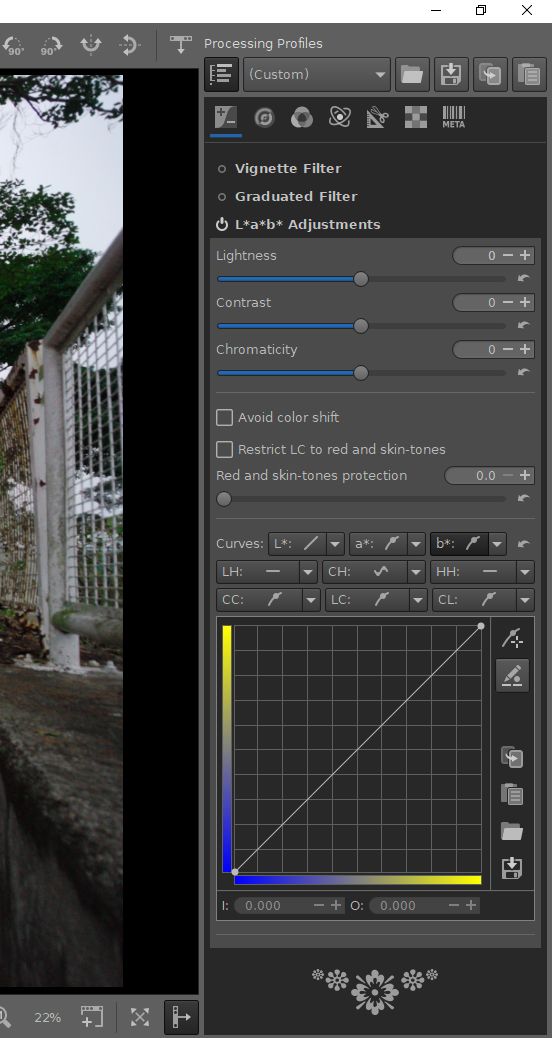
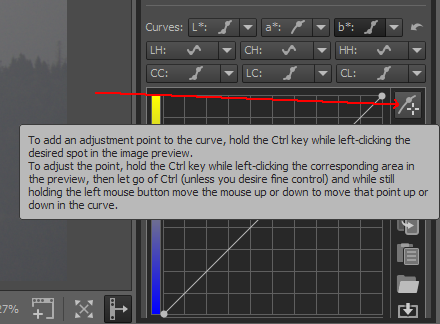
When I activate the curves for the Lab channels in the Lab Adjustment module, the histogram for the L* channel shows up OK but doesn’t for the a* or b* channels. There is no histogram either for the CL and the LC curves, but there is one for the CC curve. I’m not sure whether this is normal or if there is a problem. I use the daily v5.5 builds.
Any help would be appreciated.

Wayne Sutton

Hey

It’s normal.

1 Like

OK thanks. The Rawpedia entries for the CL and LC curves show histograms in the example images in fact so I thought I had missed something.
The reason I asked about the a* and b* channel histograms was that I was experimenting with the following technique: Using LAB Color in Photoshop to Add Color and Punch to Photos | PetaPixel
However thinking about it, this may be simply what the chromaticity slider does anyway?

Then you may be right, this could be a bug. I will take a closer look later.

By the way, check out the Color Toning tool’s Regions method, it allows you to create masks.

Will do, thanks for the suggestion!

Is there any update? Is it a bug, or did I do something wrong?

All Lab histograms are missing. And in ‘Linear’ mode the chart doesn’t show up at all.

RT v.5.5 on Windows 10

1 Like

L* and CC have a background histogram, a* and b*(the one you selected in your screenshot) never had a background histogram.

And please add a color picker too. I use that combination a lot in Darktable.

Why not use the already existing?

Without the Lab curve there is no color location on the curve. They can copy that from Darktable.

Maybe I misunderstand you. Each curve in ‘Exposure’, ‘Lab* adjustments’ and ‘RGB curves’ has a picker
grafik

as mentioned above, the CL and LC curve histograms are shown in Rawpedia. Does that mean they used to be there and were removed for some reason?

I don’t know. Maybe @Morgan_Hardwood knows