computing colour by just using the dng ForwardMatrix results in good colour near white, but sacrifices extreme values, especially apparent for blue here (out the window, see cie scatterplot in the top right):
all else being equal at least now you have a starting point with values inside the spectral locus, so no negative energies required to reproduce this image!
good news everyone!
@ggbutcher created a collection of colour luts (cluts) from a variety of ssf (from different sources and measured by himself), and they are now available in the vkdt camconst github.
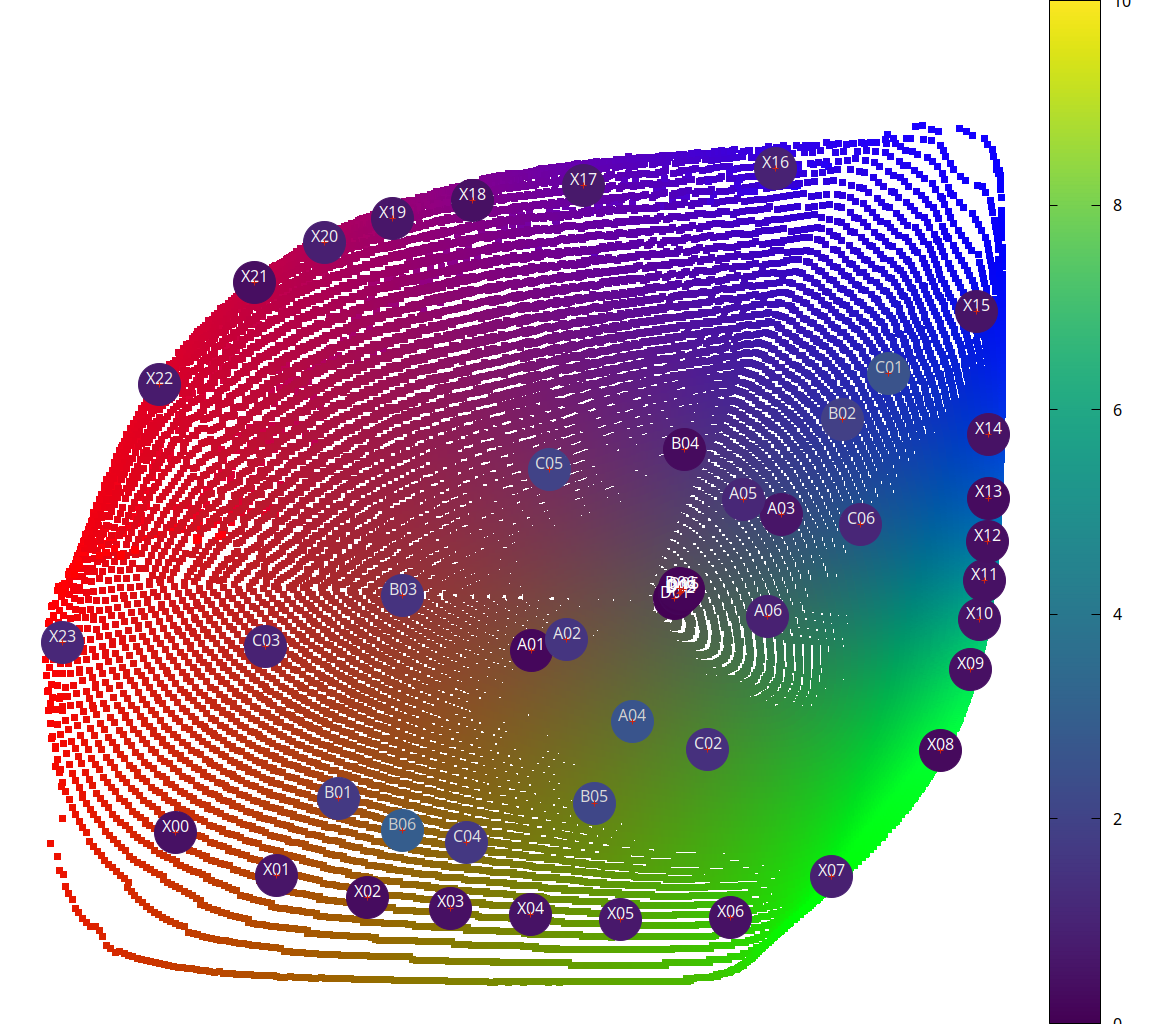
the chart here shows the camera chromaticity coordinates, and the points represent some sample spectra converted to camera rgb coordinate (by integrating them against the ssf), colour is the rec2020 coordinate of the output. the named circles show the cc24 spectra (plus a more saturated set X??) evaluated through the actual ssf, and coloured by error (deltaE, spectrum integrated against cie colourmatching vs. spectrum integrated against ssf and processed through clut).
the profile itself is essentially similar to a dcamprof lut profile. the differences are the domain (vkdt: full spectral locus, dcamprof: intersection thereof with prophotorgb) and the interpolation (vkdt: dense, dcamprof: spline).
how to apply a clut
grab the one corresponding to your camera model from the above-linked repo, place it in your data/ directory and then apply the clut.pst preset (ctrl-p in darkroom mode or node editor and then pick clut.pst).
Hi Hanatos, interesting work! So these are 2D luts? Can you explain a bit better what you mean by ‘camera chromaticity coordinates’? What are the axes and what are the lines?
these are 2.5D luts (2D lookup domain, 3D values stored there). the 2D domain is just camera rgb (r/(r+g+b), b/(r+g+b)) in analogy to the CIE xy chromaticity coordinates x = X/(X+Y+Z). these live in a triangle, but i want to store a 2D texture, so the triangle is stretched to a quad domain to make better use of the space, nothing to be proud of. just for completeness, the conversion is
(how you would sample points on a triangular light source in Monte Carlo path tracing, if you’re into this kinda thing, and not the best way to do so)
by “lines” you mean the structure in the colourful points in the background? these are just a grid of badly chosen sample spectra, sometimes they are closer together in one direction than the other, so they appear to form lines.
i want to prepare some better comparisons to dcamprof’s lut profiles, maybe create the same visualisations for their luts and for the straight matrix too. should be possible to convert dcp lut to this texture format (i don’t want to query a scattered data pointset at runtime if i can avoid it). as far as i understand dcamprof does some extra regularisation that may or not make it less accurate…
As i don’t follow the whole profiling / Lut thing completely …
… does this clip the values inside the range of the Lut ?
I dont know about vkdt , but Darktable does the input profile after exposure , so you can get values outside 0.0 - 1.0, And everytime I try a icc to use as camera profile , it clips the values to 100%.
Or is there a different method how i should use files like this ?
From what I understand this don’t clamp anything because:
camera rgb doesn’t have negative values (cameras can’t record negative light)
with this “rb chromaticity color space” it 's impossible to get values higher than 1
With the formula above “r=(r/(r+g+b),…” The result r is always < 1
Is the assumption correct that the outermost locus is the most spectrally pure? And the closer one gets to the center of those loci the closer to Illuminant E? In the D700 clut visualization, are there certain green values overlapping with less spectrally pure green values (upwards in the direction of blues)?
EDIT: I’m so sorry for my manners! This looks fantastic and just reinforces my assumption that SSFs are a must for color-sensitive stuff (so all things photography). Great great work from @ggbutcher and @hanatos . I need to get a GPU to test vkdt.
right. it’s pretty much that only with blue instead of green (flips the triangle, forgot why i did it this way, something with white balancing where i kept green constant or so).
the range of the lut is all the physically possible values. it covers the whole spectral locus and scales with brightness of the input (because it divides out r+g+b, so the global scale introduced by exposure does not matter) (what @age said).
the outermost coordinates in the quad mean something random depending on camera response function. mostly unphysical stuff that never happens (except for noise below black point maybe). the pure spectral colours are close to the outermost ring in the amoeba shaped pointcloud (i think this ring is at 95% distance or so).
hm. the rings scale towards illuminant E, so you can see a bit of structure in the pointcloud around that. the colouration is rec2020, so it renders (1, 1, 1) white where it means D65.
hehe yeah the D700 shows the metameric ambiguity between camera rgb and cie/rec2020: a certain shade of green camera rgb coordinate could potentially have been another spectral stimulus, which, to the eye, would appear as a way more saturated shade of green. given just the camera, there’s no way you will be able to tell them apart. browsing through the different models this happens quite a bit.
no. think about a spectrum between 380 and 830 nm. if you scale it up, it still has the same shape. you can do stuff with it in a normalised space and then multiply the overall scale back in the end. this is also explained in the amazing dcamprof docs. in general, the apparent brightness of a certain spectrum is different in camera rgb and CIE XYZ, that’s why it’s a 2D->3D table.
(re:icc and such… maybe i should put together a list of things wrong with the dt processing pipeline. but then again maybe not).
That’s what I was trying to get at. Thanks!
I assume you generated the “rings” by sampling the camera SSFs with spectrally broader and broader virtual lights? Maybe even gaussian shaped? If so, it would be possible to plot lines of constant illuminant center-wavelength within that clut space?
I’m looking forward to see what effects this has on real-worl gradients. Specifically how spectrally pure light-sourced gradients are affected. Even more so compared to matrix solutions. And which CFAs are better and which are worse. Super interesting stuff.
(writing this on my cell phone, with dodgy Internet in the woods…)
+1 to the dcamprof docs! Even if you never use the software, Anders has compiled a treasure trove of information on camera profiling. I’ve just spent the morning with a local copy, trying to better understand the mechanics of luts in this application. Every time I do such, I learn something new…
well integrating the same ssf against sampled spectra, yes.
only spectral colours (and from there towards white) could be gaussian. the purple line is more like 1-gaussian (needs two peaks or a dip). dcamprof has some xy → gaussian spectra upsampling routine that i didn’t look into in detail yet. i’m using this method just because it’s so dead simple. i think real spectra would be better, but these are harder to sample densely in xy space. certainly room for improvement here.
reflectance spectra with mode/peak at constant wavelength? yes:
(all the way to the right would be the spectral colour, but it stops displaying stuff at boundaries of adobergb)
this is what the colour module uses for hue-preserving gamut mapping and changing chroma (following mizokami and webster 2012 if that is close to the idea you are proposing).
Ooh, had to take a break from my other stuff to do this…
Plotted their predicted Nikon D7000 against rawtoaces monochromator-measured D7000:
Blue overall sensitivity is divergent, but the overall band separation is consistent. I’d say there’d probably be a bit of white balance difference using their data, but the color hue reproduction should be close. When I get a bit more time I can run it through dcamprof for a max dE.
Edit: Forgot to mention, I had to normalize their data to 0.0-1.0 for the plot.
nice, curious to hear your opinion on this… i created a couple luts and compared to image renditions with dng matrix and mkssf lut. seemed to me the wb is more on the blue side, but it’s not a simple multiplication by D65 or something. at least this seems to be the case for my canon 5d2 and the fuji x100t. maybe it’s D55?
i mean at the very least i could use the reference ground truth spectra they collected and augment the PCA model used in mkssf to get a better grip at some newer sensors that aren’t well reflected in this model so far. running mkssf + mkclut is not too much trouble as compared to just running mkclut on their data directly.
I used dcamprof to make profiles for each of the datasets.
Predicted:
  D02 DE 0.00 DE LCh +0.00 +0.00 +0.00 (gray 80%)
  D06 DE 0.07 DE LCh +0.02 -0.06 +0.03 (gray 20%)
  D03 DE 0.15 DE LCh -0.02 -0.04 -0.14 (gray 70%)
  D04 DE 0.16 DE LCh -0.02 -0.06 -0.15 (gray 50%)
  D05 DE 0.20 DE LCh -0.01 -0.03 -0.20 (gray 40%)
  D01 DE 0.83 DE LCh -0.14 -0.75 -0.34 (white)
  A01 DE 0.95 DE LCh -0.06 +0.45 +0.84 (dark brown)
  A04 DE 0.96 DE LCh -0.66 +0.62 -0.32 (yellow-green)
  A06 DE 1.14 DE LCh +0.28 -0.72 +0.83 (light cyan)
  B04 DE 1.22 DE LCh +1.03 -0.14 +0.62 (dark purple)
  A03 DE 1.23 DE LCh +0.87 -0.91 -0.48 (purple-blue)
  B03 DE 1.23 DE LCh +0.98 -0.30 -0.67 (red)
  A02 DE 1.36 DE LCh +0.48 -0.09 -1.27 (red)
  A05 DE 1.36 DE LCh +1.13 -0.25 +0.61 (purple-blue)
  B02 DE 1.83 DE LCh +1.53 -1.59 -0.90 (purple-blue)
  C01 DE 1.84 DE LCh +1.50 -1.63 -1.43 (dark purple-blue)
  C02 DE 2.07 DE LCh -0.30 -1.77 +1.03 (yellow-green)
  B01 DE 2.15 DE LCh -0.35 -1.31 -1.66 (strong orange)
  B06 DE 2.30 DE LCh -0.69 -2.12 -0.55 (light strong orange)
  C03 DE 2.45 DE LCh +2.17 -0.39 -1.06 (strong red)
  C06 DE 2.50 DE LCh +2.06 -0.38 +1.37 (blue)
  C05 DE 2.71 DE LCh +2.11 -0.68 +1.56 (purple-red)
  B05 DE 3.29 DE LCh -1.09 -2.95 +0.93 (light strong yellow-green)
rawtoaces:
  D02 DE 0.00 DE LCh +0.00 +0.00 +0.00 (gray 80%)
  D06 DE 0.09 DE LCh +0.02 -0.08 +0.03 (gray 20%)
  D03 DE 0.11 DE LCh -0.01 -0.07 -0.09 (gray 70%)
  D04 DE 0.12 DE LCh -0.01 -0.02 -0.12 (gray 50%)
  D05 DE 0.16 DE LCh -0.00 -0.04 -0.15 (gray 40%)
  A01 DE 0.41 DE LCh -0.04 +0.26 +0.32 (dark brown)
  D01 DE 0.69 DE LCh -0.13 -0.64 -0.22 (white)
  A04 DE 0.80 DE LCh -0.64 +0.43 -0.23 (yellow-green)
  A06 DE 1.05 DE LCh +0.24 -0.60 +0.82 (light cyan)
  A03 DE 1.10 DE LCh +0.84 -0.76 -0.28 (purple-blue)
  A02 DE 1.18 DE LCh +0.53 +0.12 -1.05 (red)
  B03 DE 1.24 DE LCh +1.14 -0.07 -0.49 (red)
  B04 DE 1.35 DE LCh +0.82 -0.87 +0.61 (dark purple)
  C02 DE 1.50 DE LCh -0.32 -1.37 +0.51 (yellow-green)
  A05 DE 1.55 DE LCh +1.06 -0.89 +0.41 (purple-blue)
  B02 DE 1.59 DE LCh +1.47 -1.05 -0.88 (purple-blue)
  B06 DE 1.73 DE LCh -0.85 -1.45 -0.44 (light strong orange)
  C01 DE 1.76 DE LCh +1.59 -0.94 -1.18 (dark purple-blue)
  B01 DE 1.85 DE LCh -0.40 -0.86 -1.59 (strong orange)
  C03 DE 2.27 DE LCh +1.91 -0.60 -1.08 (strong red)
  B05 DE 2.41 DE LCh -1.11 -2.00 +0.75 (light strong yellow-green)
  C05 DE 2.42 DE LCh +1.97 -0.71 +1.21 (purple-red)
  C06 DE 2.69 DE LCh +2.04 -1.08 +1.35 (blue)
  C04 DE 2.76 DE LCh -0.77 -2.62 -0.36 (light vivid yellow)