After some time playing with astrophotography, recently I’ve started to perform photometry. I’m using an OSC camera, so the first step after calibration, and without debayering the sequences, is extracting the green chanel and work with it. Perfect, it works like a charm. Then my problems stated
- When I perform a PSF for the sequence and shows the magnitude plot… it appears inverted. I mean, bigger magnitude values represent, lower brightness, so we you draw the curve of a RR Lyrae variable near its maximum, you get a bowl

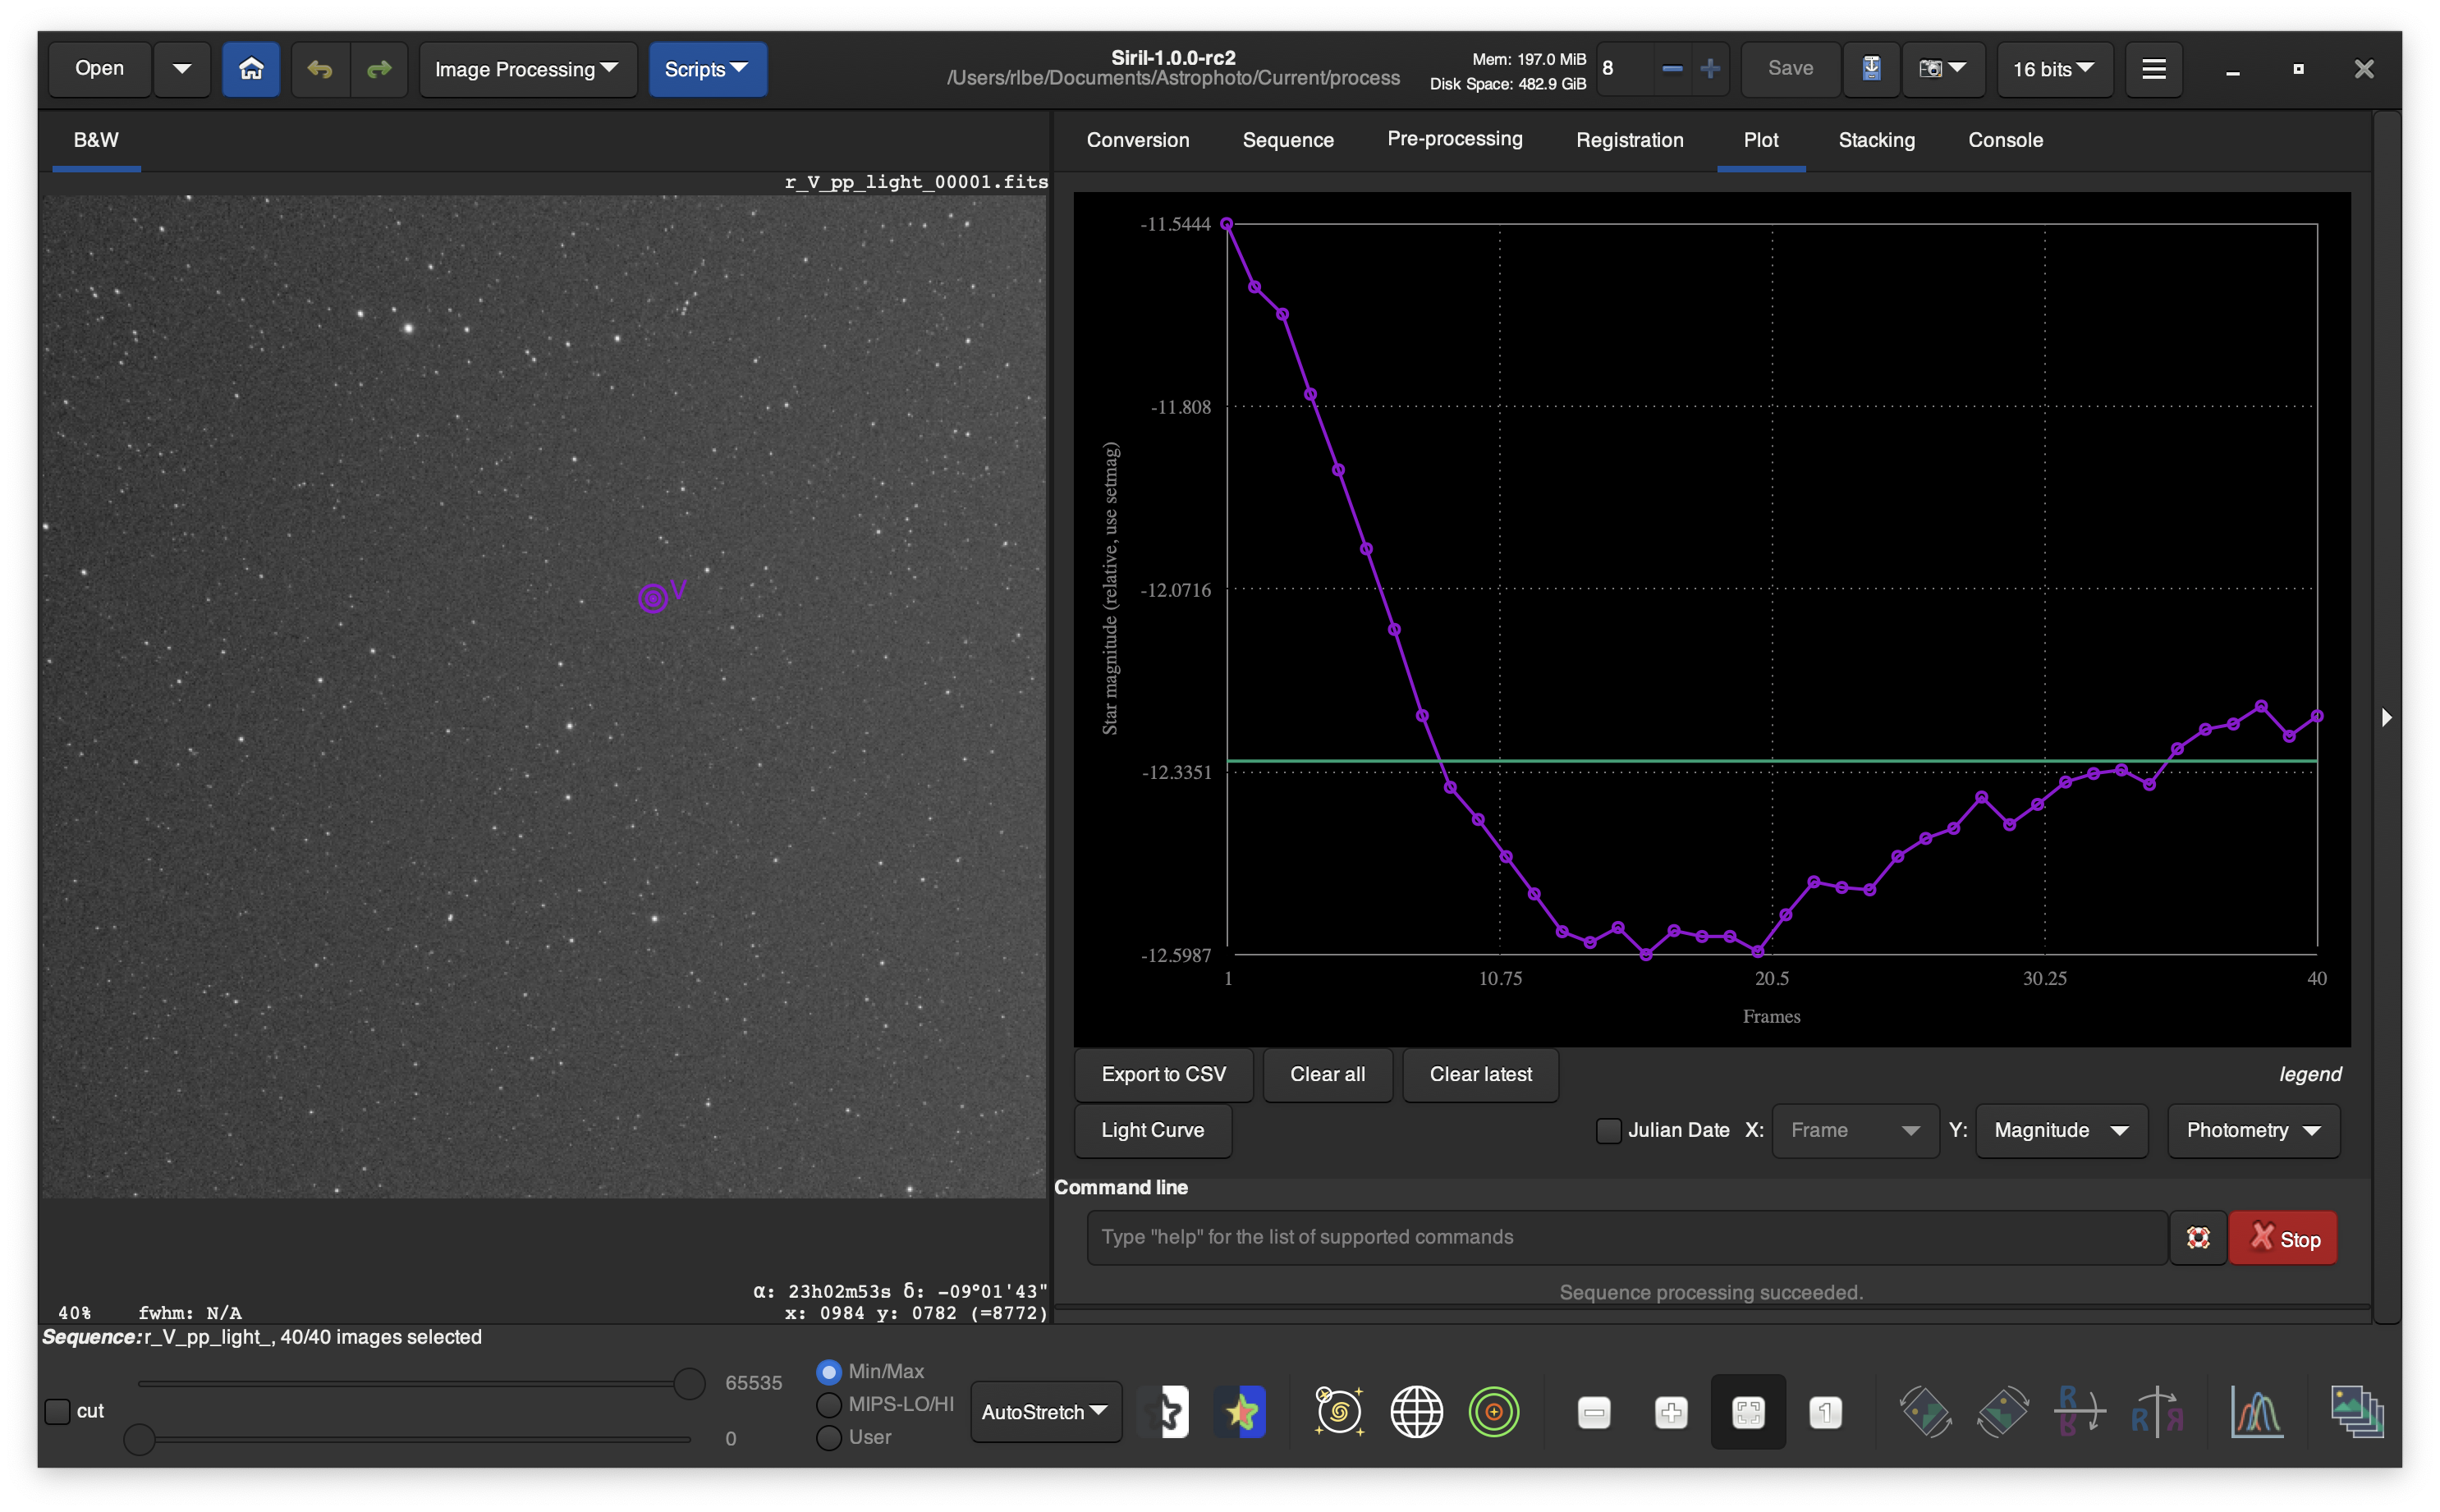
So, perhaps when the Y value is magnitude, it will be useful to invert the Y axis.
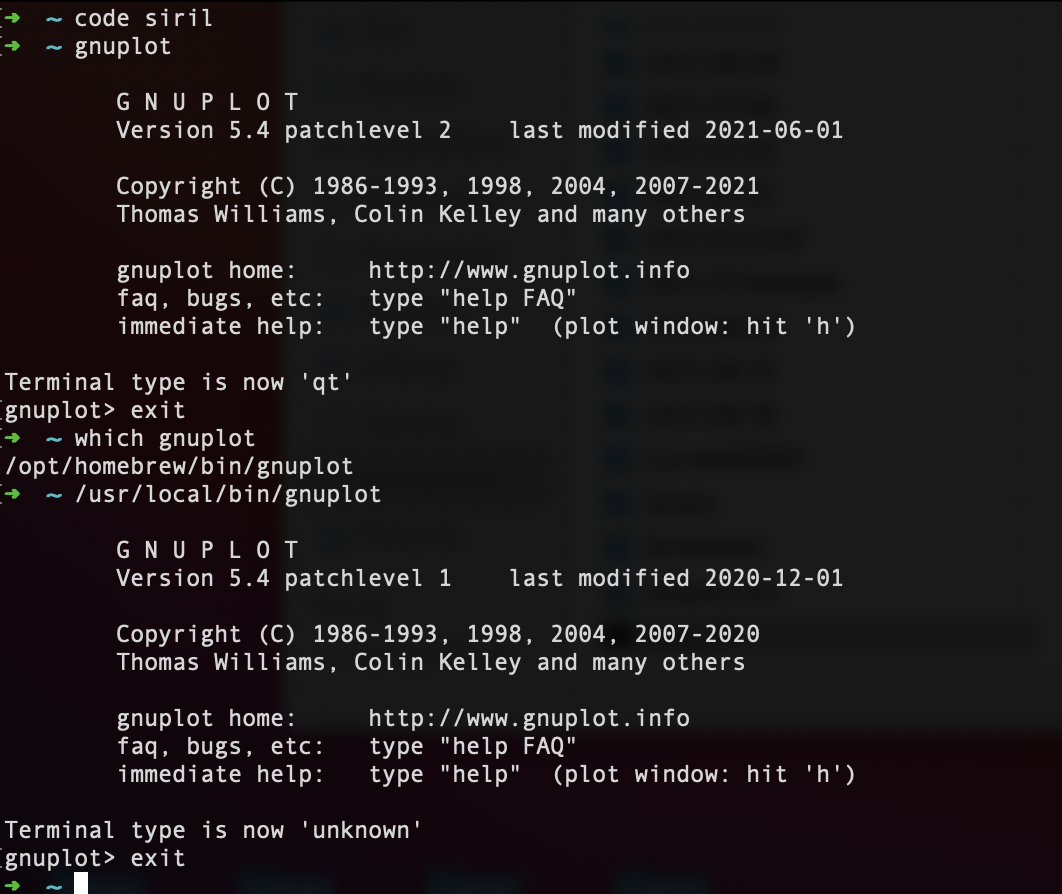
- If I select some other stars and try to export the light curve I receive an error. Yes, I have gnu plot installed on my computer (if I type gnuplot on a terminal, it runs perfectly fione). Perhaps the problem is that gnuplot is not located at /usr/bin, but at /opt/homebrew/bin/gnuplot. And not, the solution is not to generate a symlink to it on /usr/bin, because this folder on recent versions of macOS is read-only. Yes I know that you can bypass this restriction, but then I’ll be fired
I’ve read the SiriL source code and it seems to me that it simply ask for the path to a system library, so no special handling is done… and this is bad for us, Mac users.
I’ve tried to compile it on my Mac (with an M1 processor), but unfortunately it doesn’t compile. Again I’m getting errors related with omp library
…/src/core/siril.h:14:10: fatal error: ‘omp.h’ file not found
#include <omp.h>
So I can’t investigate the problem any farther by myself.
- The worst part is that when Siril doesn’t find gnuplot, it neither generate the .dat file with the photometric data. Could at least this file will be generated?. I mean, first generate the file and then, if available, run it through gnuplot.
And last, but not least will be an option to generate a synthetic Luminosity file from OSC data. I mean, you have 2G+R+B pixels on each 2x2 binned pixel or “super pixel”. As we know that those filters are for visual observation, we can apply the NTSC
Gary = 0.299 ∙ Red + 0.587 ∙ Green + 0.114 ∙ Blue
And then save it as a binned mono image. What do you think about this? I know that the less your manipulate your images before measuring them, the best. But the problem is that the bayer matrix interferes with the measurement.
I know that extracting the green chanel, I’m in some way avoiding this problem, but at the same time I’m loosing a lot of light.
For example, look at this frame:
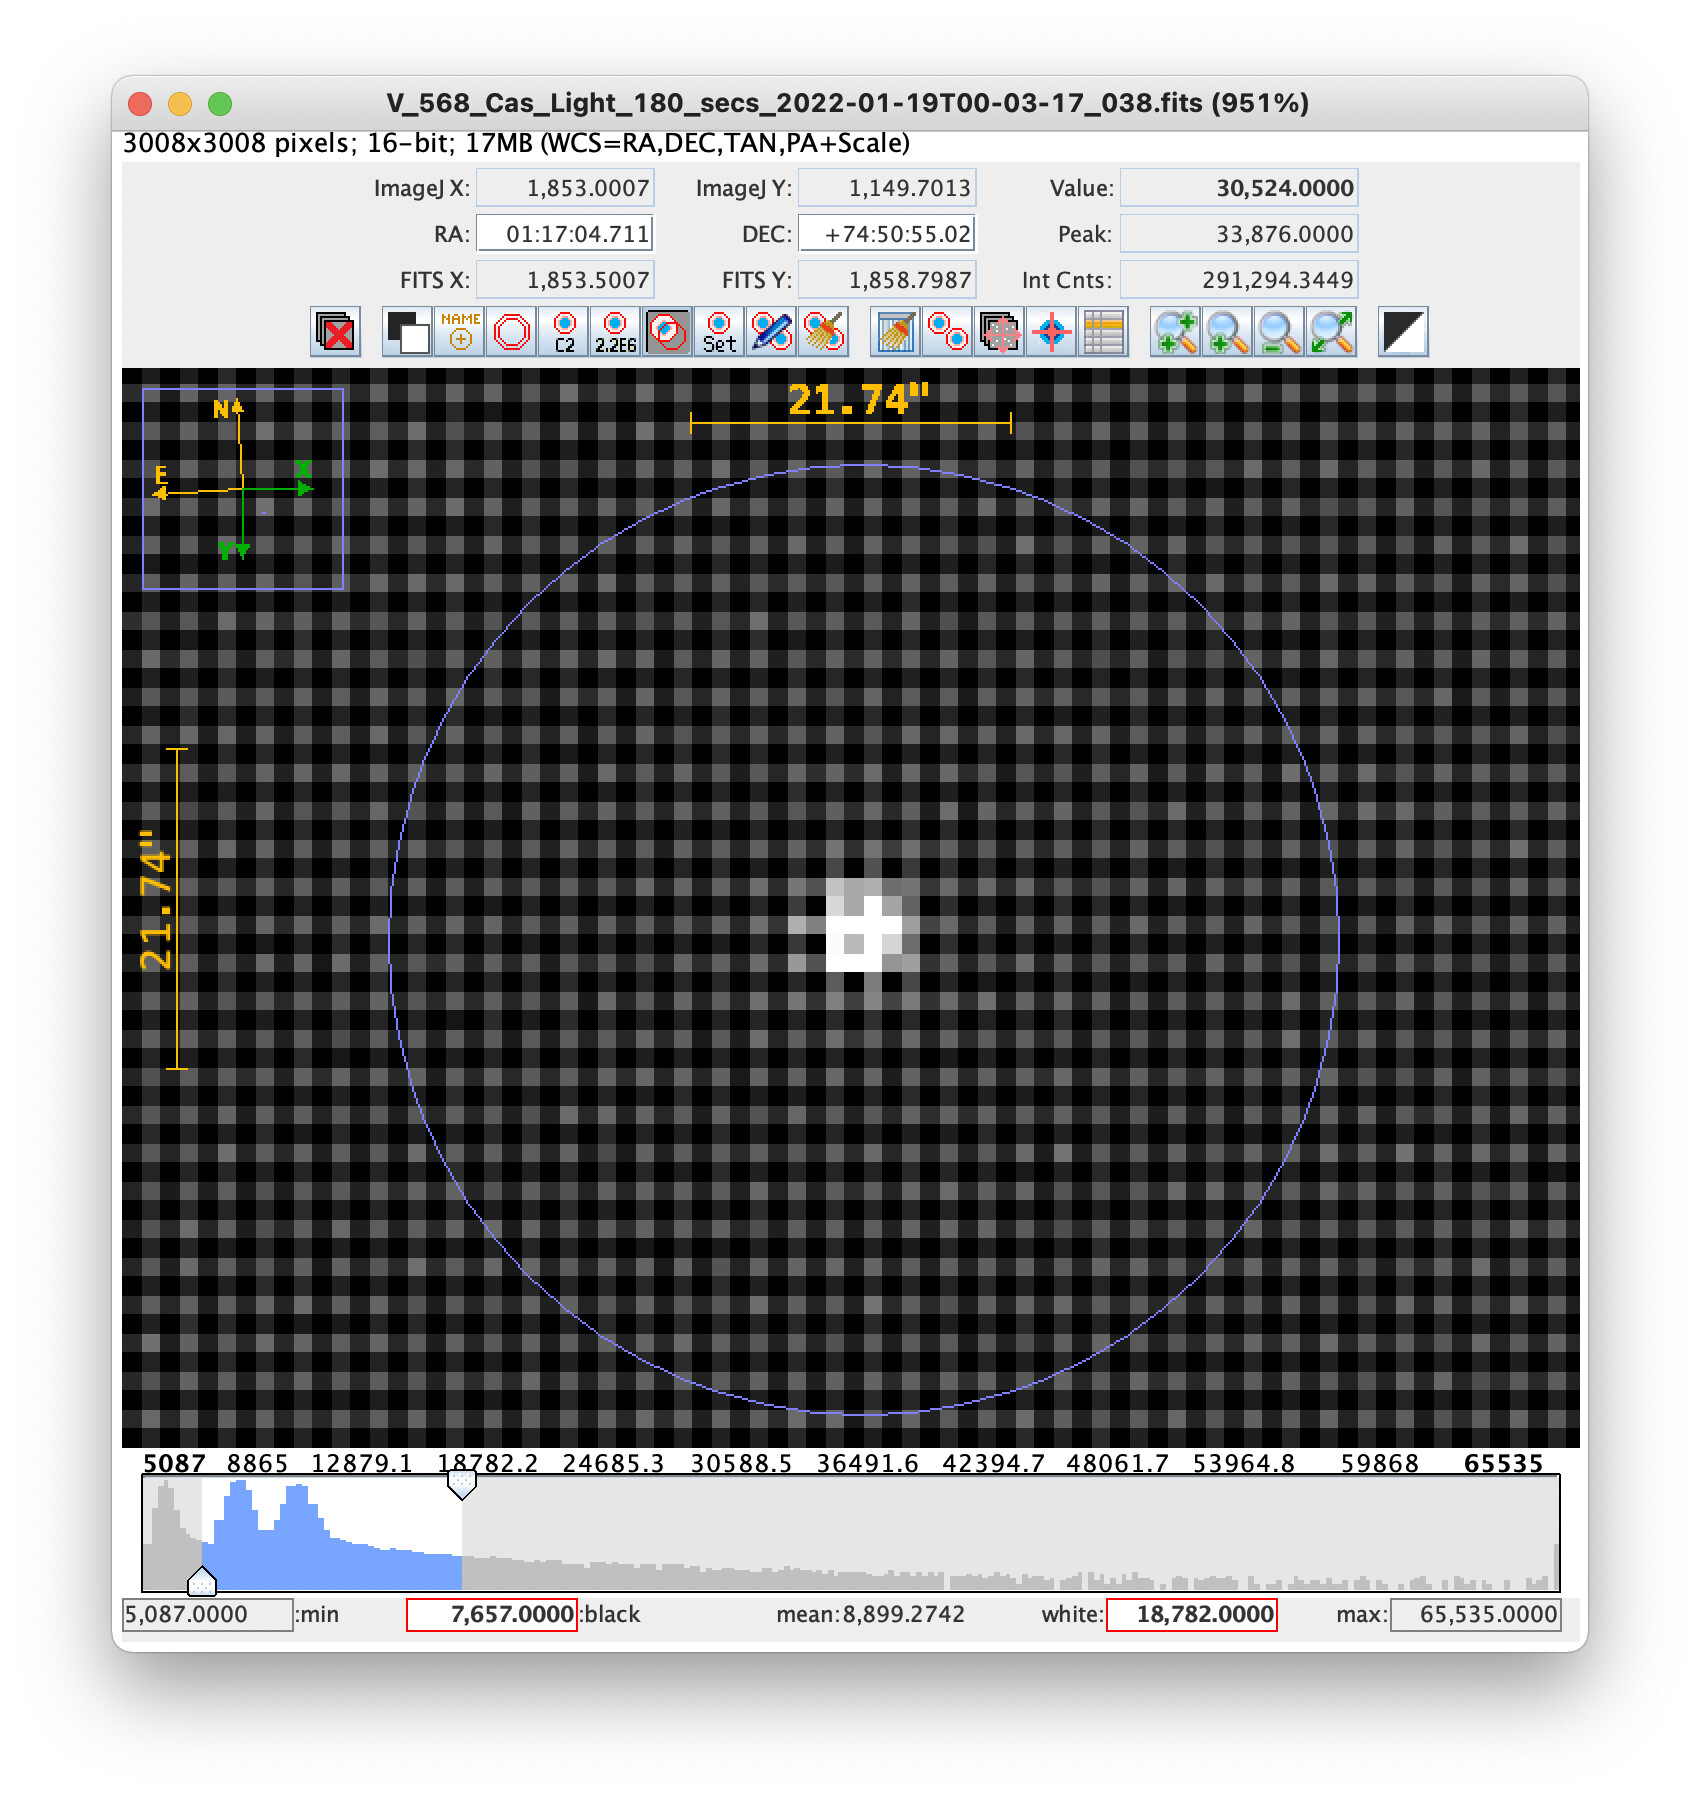
The Bayern pattern is perfectly visible on the background and over the star I’ll mesure. Then if we look at the green chanel extracted for this picture
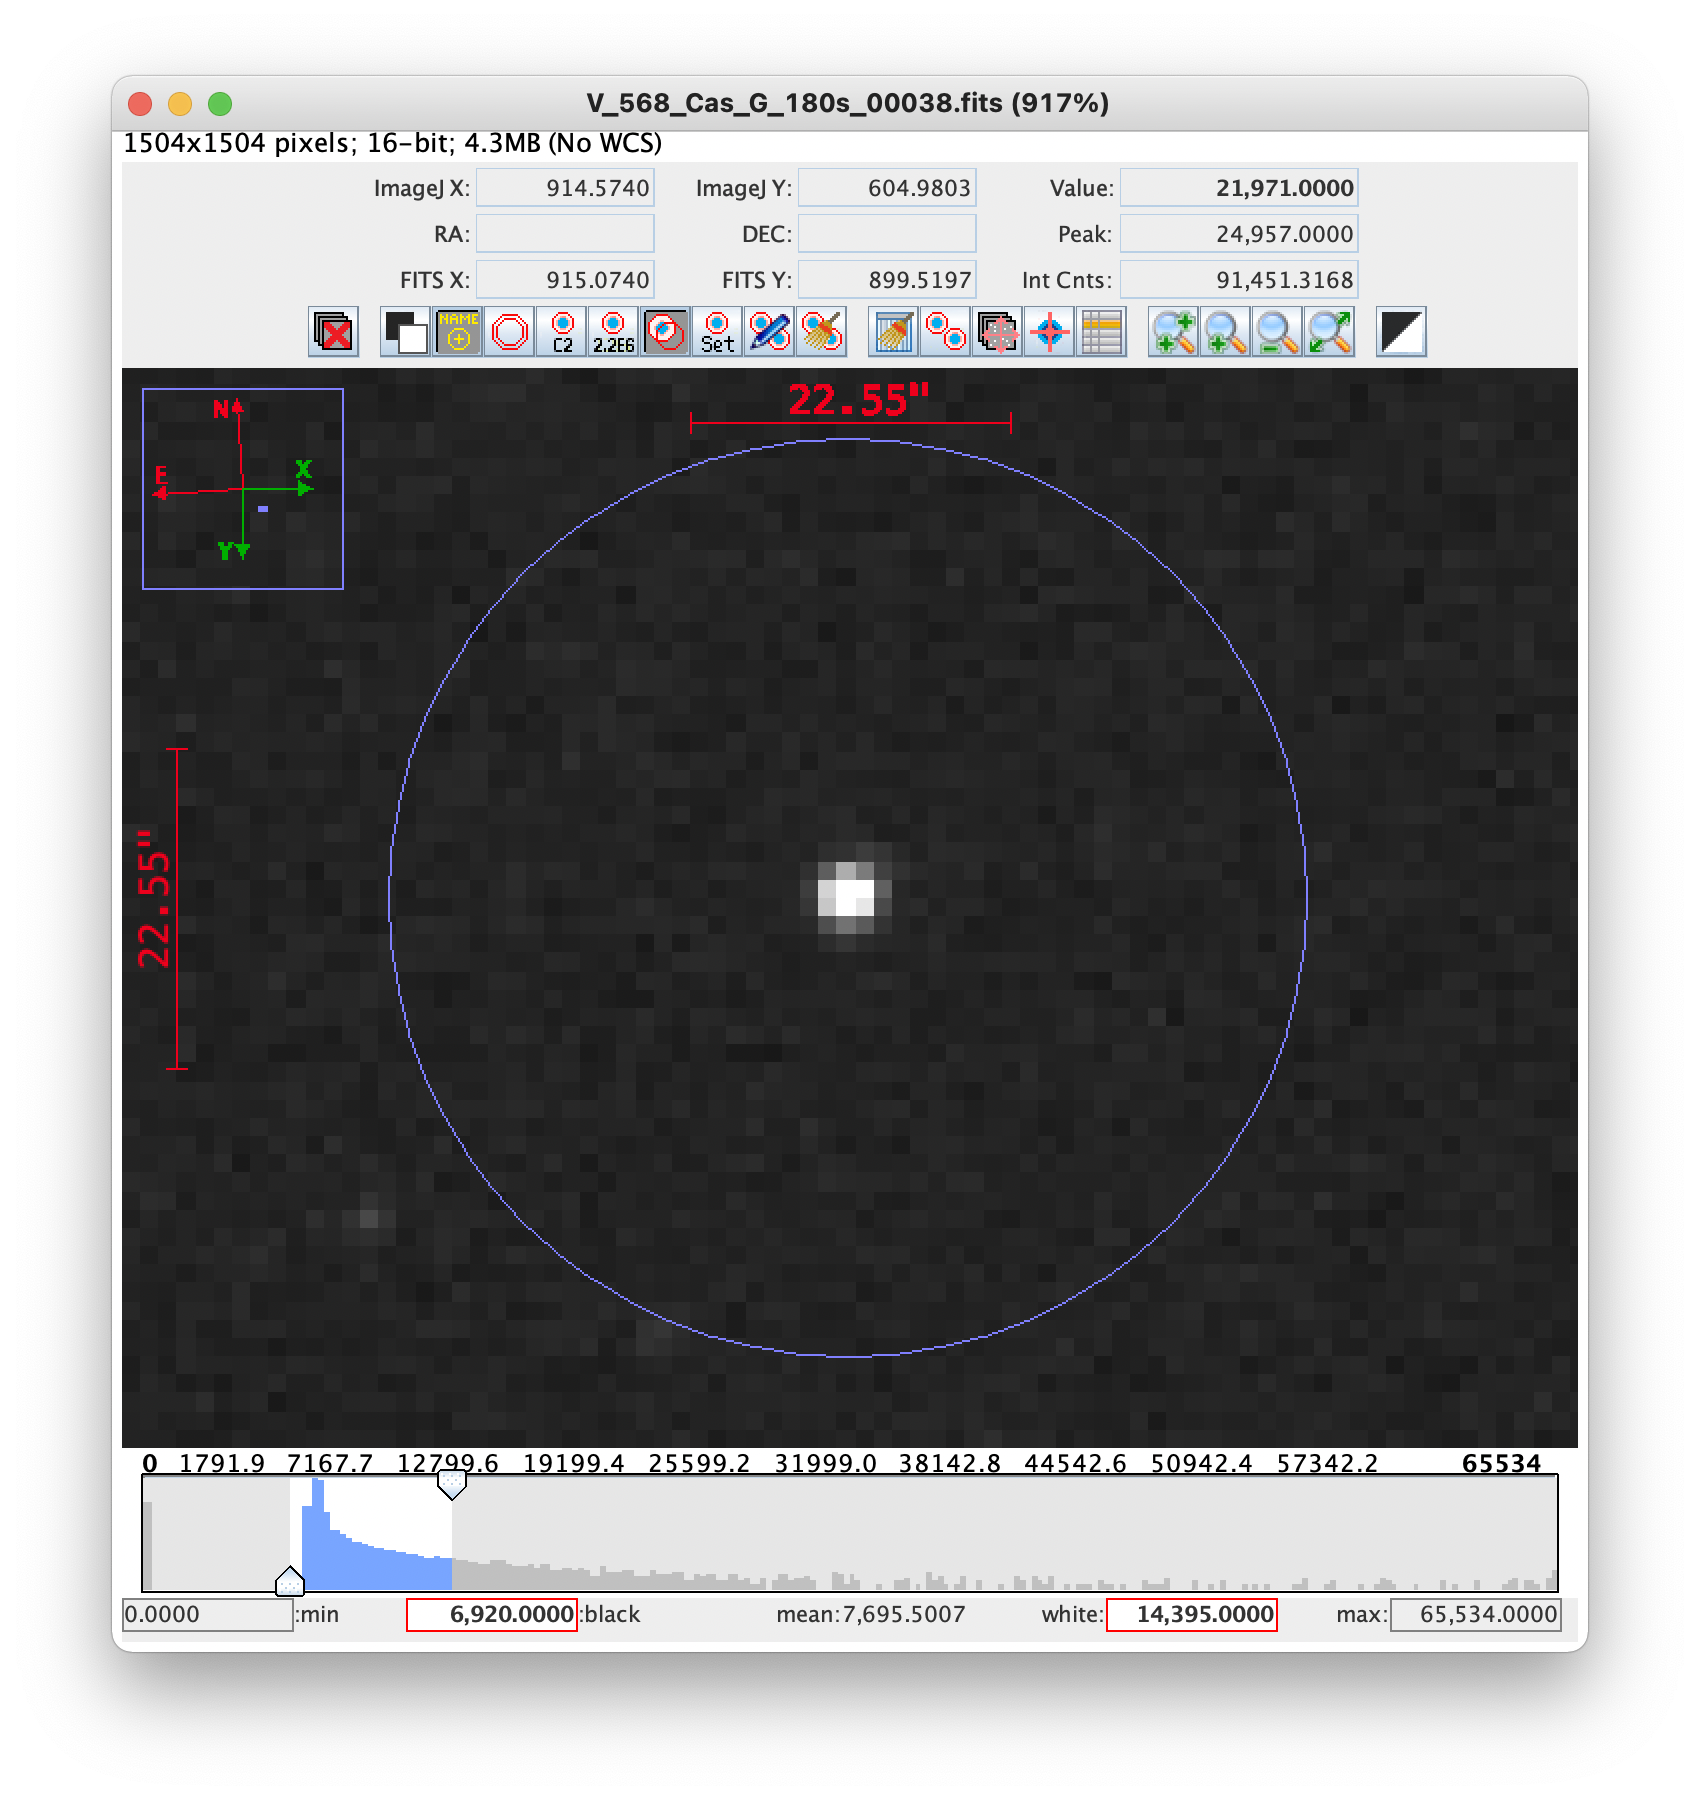
It looks nicer, but I’ve lost all the R and B pixels from it. What do you think?