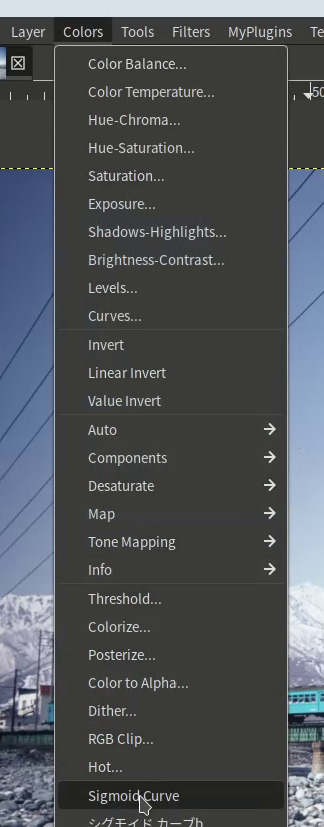
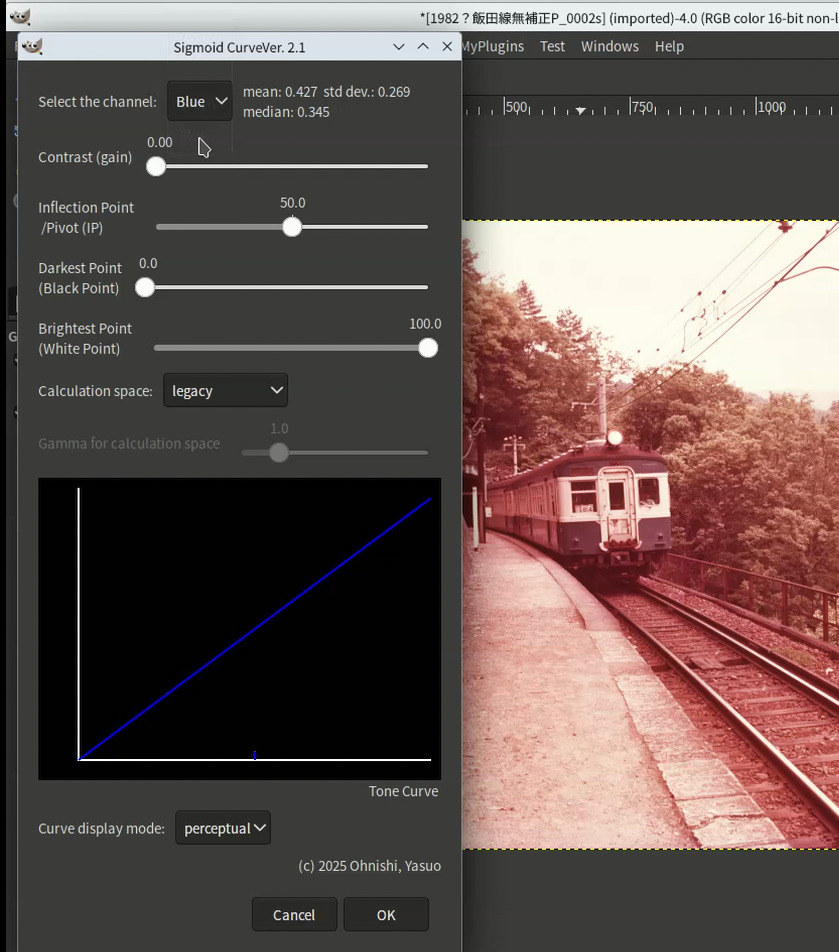
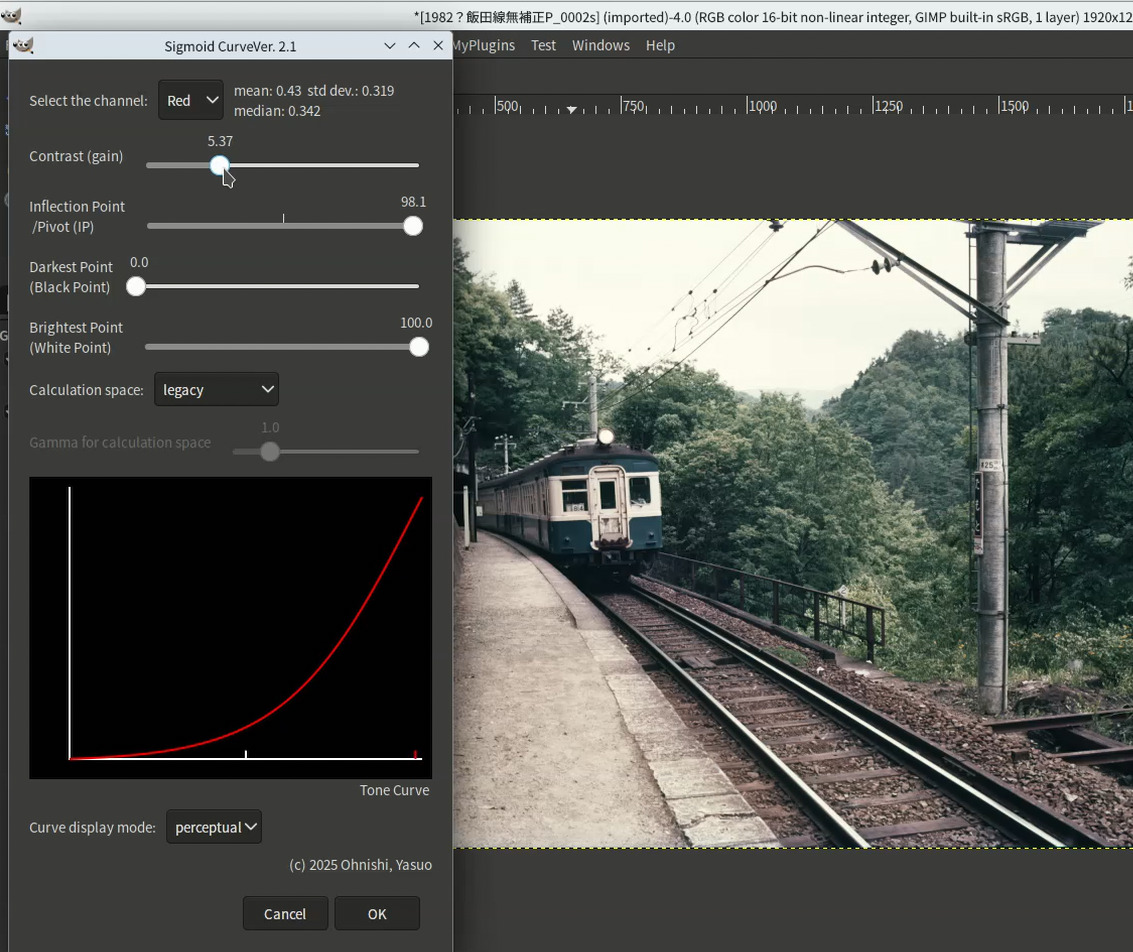
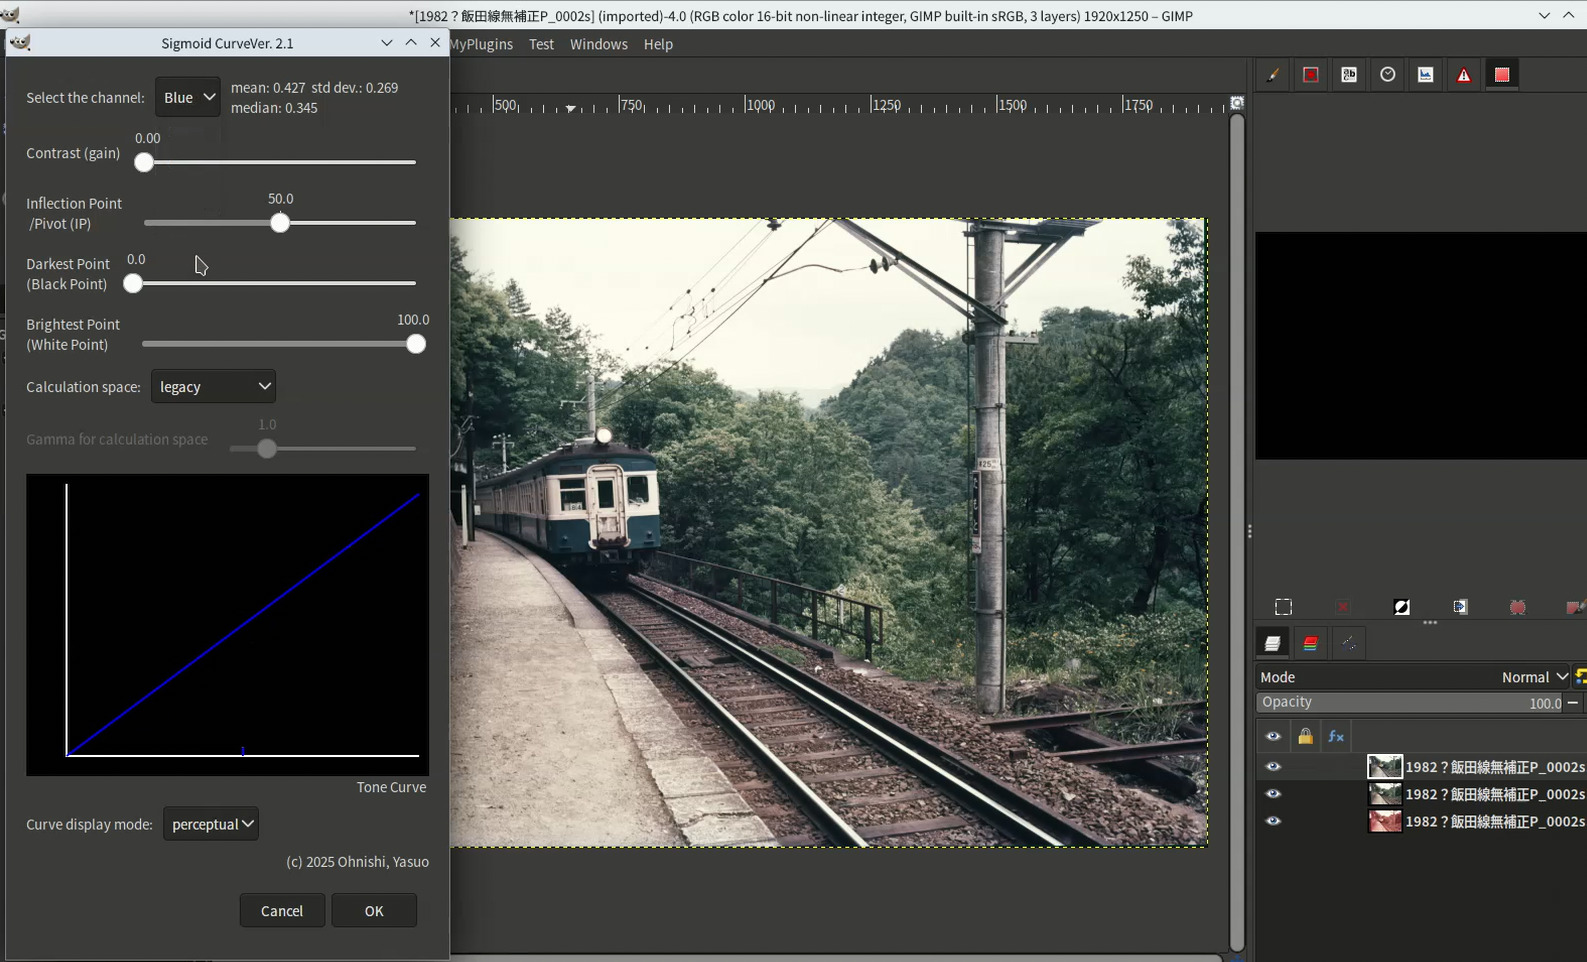
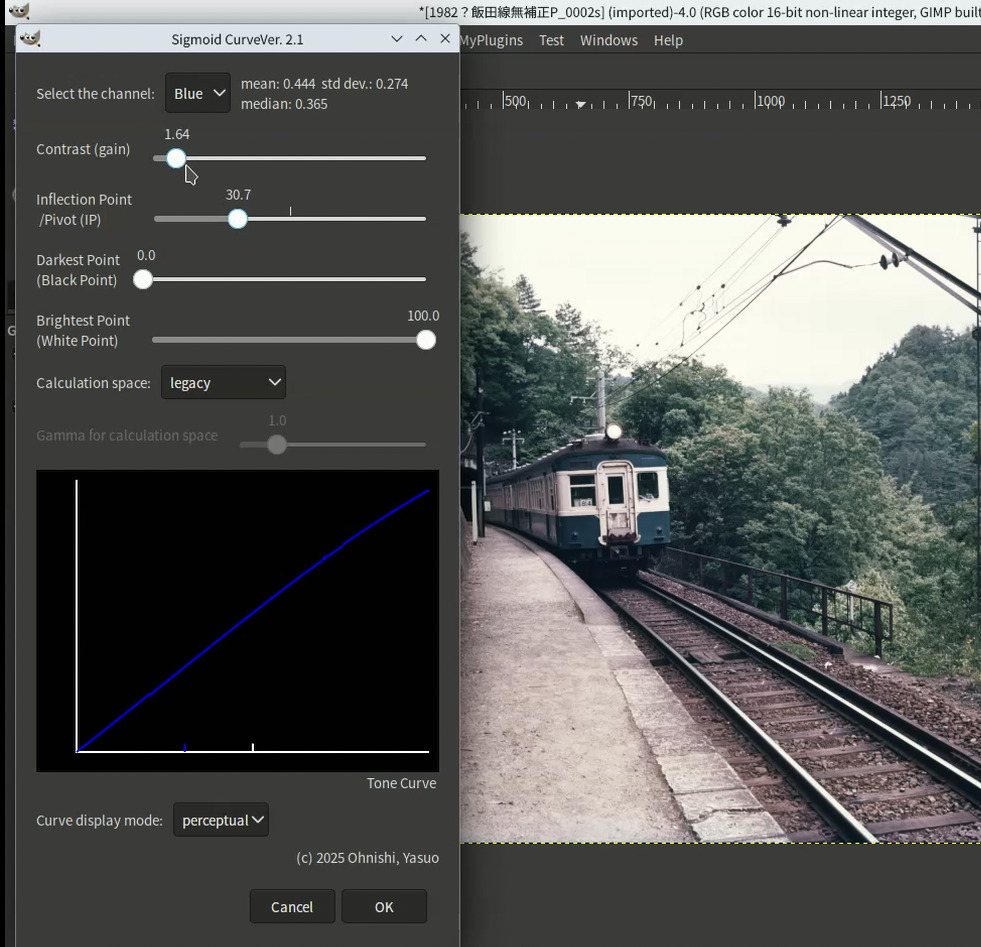
Sigmoid Curve — @yasuo, post:1, topic:51168
Sigmoid Curve plugin — explanation for photographers + bug fixes
Thanks so much for this plugin. It’s really sophisticated, giving parametric
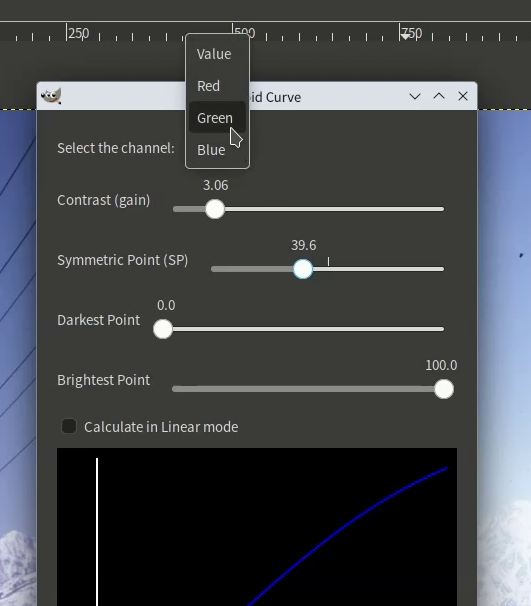
control over a mathematically precise curve, calculation space options icluding custom gamma, per-channel editing, and a live preview that updates as you drag. That’s a lot of thoughtful engineering packed into a clean interface.
I wanted to add two things: some context for photographers who might scroll past because “sigmoid curve” sounds like a math thing, and some bug fixes I worked out while testing.
What is a sigmoid curve, and why should I care?
A sigmoid curve is a mathematically precise s-curve. Instead of dragging curve points around by hand, the math delivers a smooth, symmetrical curve that’s easily reproducible.
How is it different from drawing an s-curve manually?
Drawing an s-curve by hand is finicky. You have fine control, and can generate lovely creative effects, depending on where you place your points. A sigmoid curve is more mathematically correct because it’s defined by a formula. It can be a good starting point for more creative effects, and it’s ideal for batch processing when you want consistency across a series of photos.
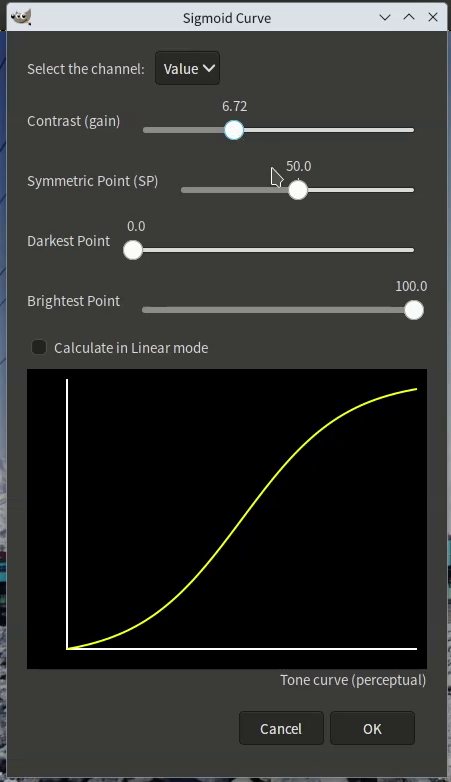
The sliders make this plugin super usable
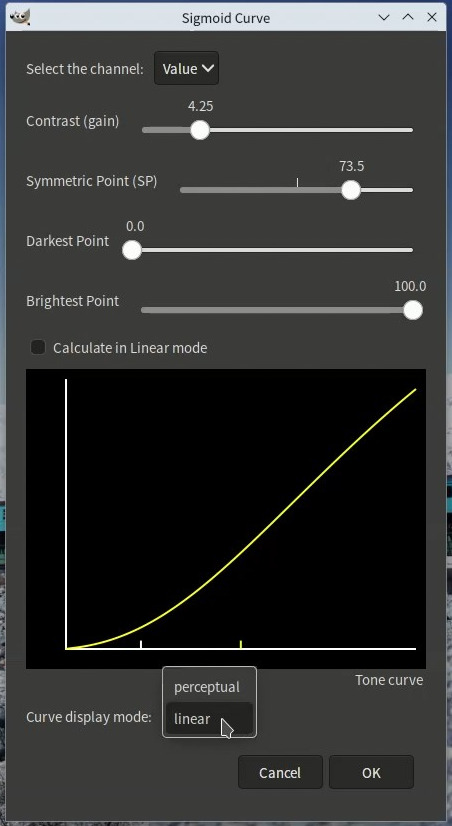
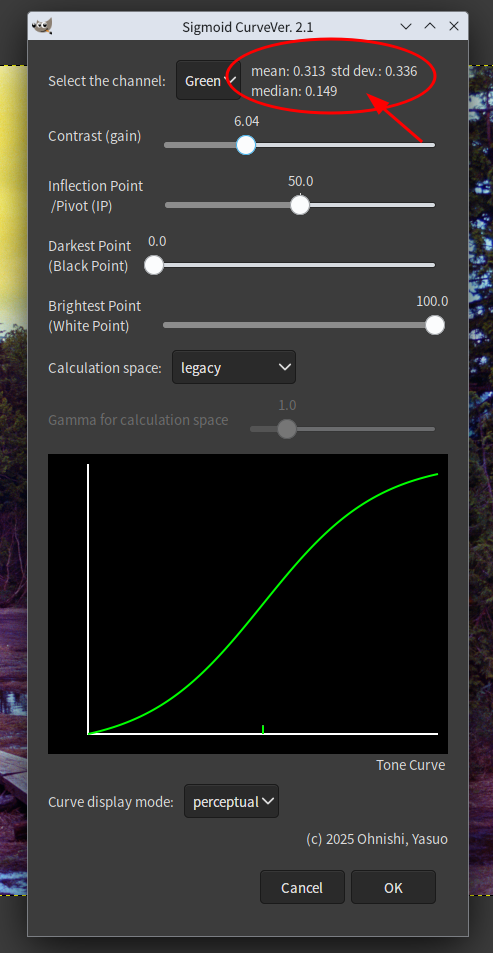
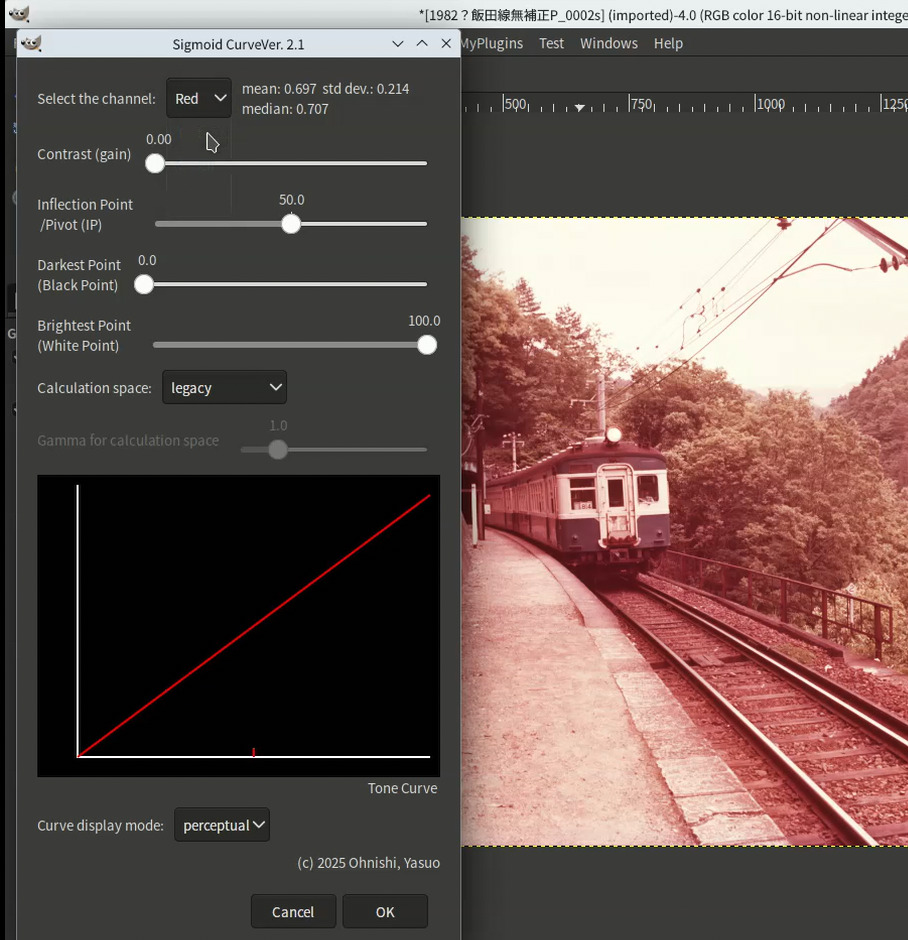
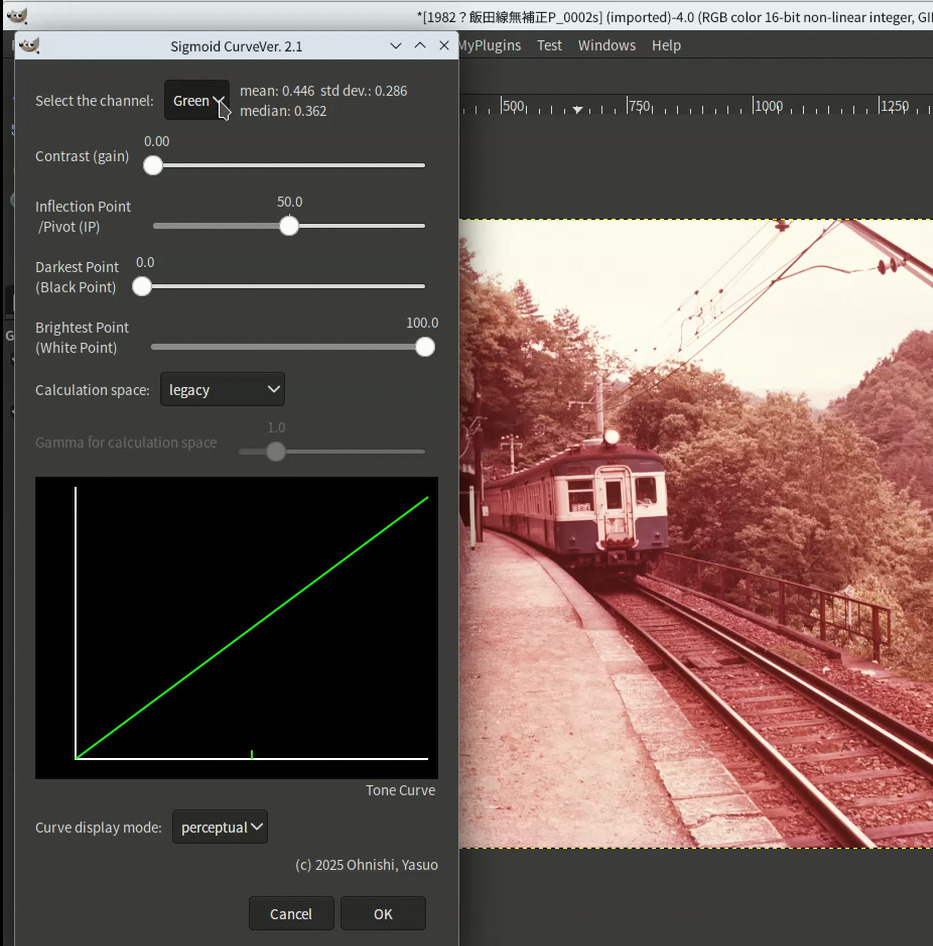
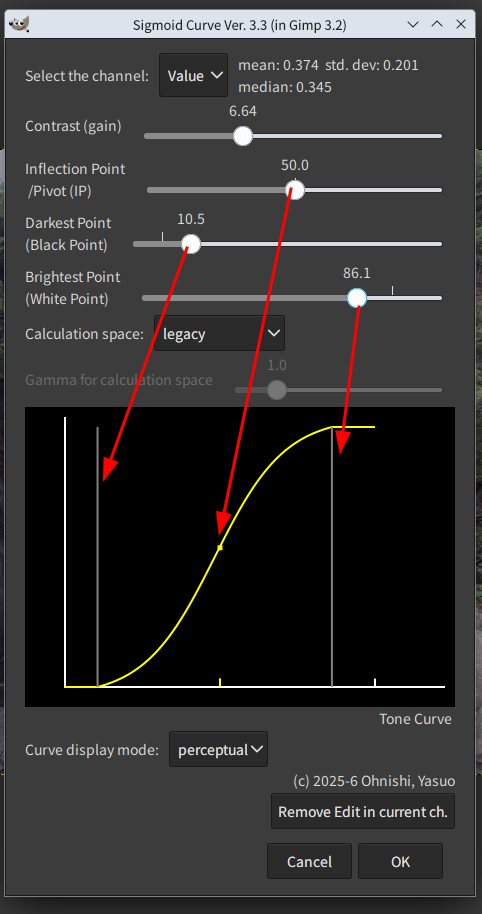
- Contrast (gain) controls how aggressive the s-shape is: a low value gives a gentle lift while a high value is more aggressive.
- Inflection Point shifts where the contrast boost is centred in the tonal
range. Below 50 biases contrast toward shadows; above 50 biases toward
highlights. You can target exactly where you want the adjustment to land
without touching separate shadow/highlight sliders.
- Black Point / White Point clamp the extremes, protecting shadow detail and preventing highlights from blowing out while the contrast adjustment does its work.
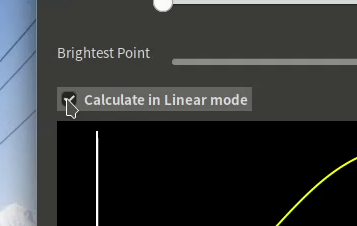
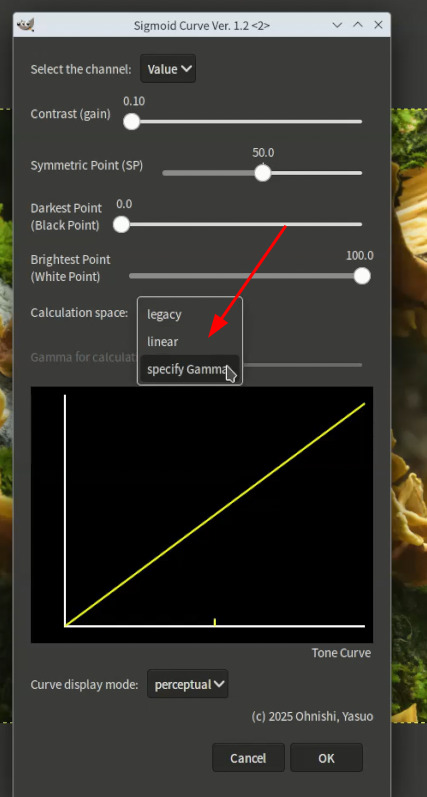
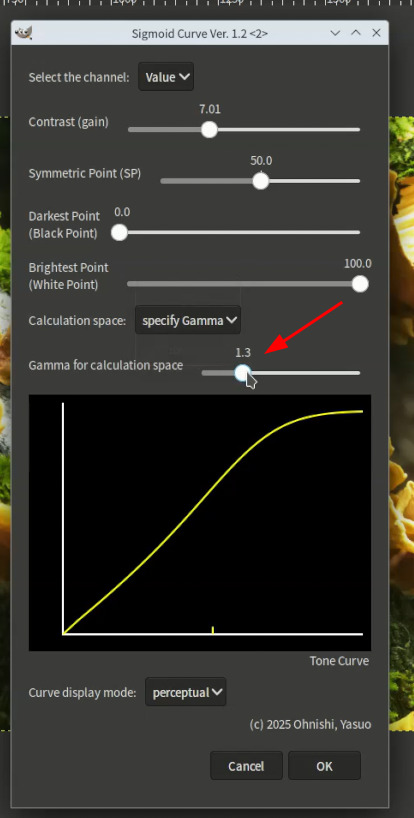
- Calculation space controls whether the sigmoid is applied in perceptual (sRGB) space, linear light, or a custom gamma. Legacy/perceptual is the most intuitive because the curve behaves the way your eye sees it. Linear is more physically accurate and tends to preserve shadow detail better on high bit-depth images. Specify Gamma lets you specify a specific gamma value to the linear option.
When is this useful?
- Flat images that need punch without clipping shadows or highlights
- A general s-curve that you then fine tune for creative reasons
- Consistent results across a series of shots taken in the same conditions
- Contrast adjustments targeted at a specific tonal range (just shadows, just
midtones, just highlights)
- High bit-depth images where working in linear space gives cleaner results
When won’t it help?
- Recovering badly blown highlights or crushed shadows — those need targeted recovery adjustments, not a contrast curve
- Heavy creative grading with asymmetric tonal shifts (warmer shadows, cooler highlights) — a freeform curve gives more flexibility there
For everyday contrast work, this plugin will often be faster, more precise, and more repeatable than drawing curves by hand.
Bug fixes
While testing I found several bugs, all in update_curve() and the graph
display code. I’m posting diffs against the version 3.1 source. All fixes have
been tested on GIMP 3.2.4, 16-bit non-linear image.
Bug 1 — dRange() remapping logic was inverted
The original code applied white point and black point scaling in the wrong order, distorting the lower end of the input range before it reached the sigmoid. The correct formula is a simple linear remap from [darkest, brightest] to [0, 1].
-def dRange(x,darkest,brightest):
-    # BP, WP adjustment
-    maxFactor = 1.0 / brightest
-    x2 = min(x * maxFactor, 1.0)
-    minFactor = 1.0 / (1.0 - darkest)
-    x2 = 1.0 - (1.0 - x2) * minFactor
-    x2 = max(x2, 0.0)
-    return x2
+def dRange(x, darkest, brightest):
+    """Remap x from [darkest, brightest] to [0.0, 1.0].
+    Values outside the range are clamped.
+    """
+    if brightest <= darkest:
+        return 0.0
+    x2 = (x - darkest) / (brightest - darkest)
+    return max(0.0, min(1.0, x2))
Bug 2 — Inflection Point slider direction was inverted
The tooltip said “below 50 = more shadow contrast” but the behaviour was the opposite. Fixed by inverting sp after all space conversions, immediately before it is passed to sigmoidAdj. The inversion must happen last — doing it before srgbToLinear corrupts the value in linear mode.
-        sp = self.sp / 100.0
+        sp = self.sp / 100.0
         darkest = self.darkest / 100.0
         brightest = self.brightest / 100.0
+        calcGamma = 1.0  # safe default; overwritten below if linear mode is active
         if self.linear == True:
-            sp = srgbToLinear(sp)
             darkest = srgbToLinear(darkest)
             brightest = srgbToLinear(brightest)
             calcGamma = self.savedValue[i][4]
             if calcGamma != 1.0:
-                sp = sp ** (1.0 / calcGamma)
                 darkest = darkest ** (1.0 / calcGamma)
                 brightest = brightest ** (1.0 / calcGamma)
+        # Invert AFTER space conversion so shift is in the same space as
+        # pointsX2. Low IP = shadow contrast, high IP = highlight contrast.
+        sp = 1.0 - sp
Bug 3 — X/Y misalignment: curve X axis did not match Y values
pointsX2 (the dRange-adjusted values) was fed to sigmoidAdj to produce pointsY, but the original pointsX ramp was used as the curve’s X axis. The
Y values corresponded to adjusted input positions, not the original ones, so the curve was applied at the wrong X positions.
-        curve=[p for xy in zip(pointsX,pointsY) for p in xy]
+        # Use pointsX2 (dRange-adjusted) as X axis so curve X positions
+        # match the Y values computed from them.
+        curve=[p for xy in zip(pointsX2,pointsY) for p in xy]
Bug 4 — TRCType hardcoded to LINEAR regardless of calculation space
In GIMP 3.2, TRCType tells GIMP which colour space to apply the curve in.
Legacy mode calculates the sigmoid in sRGB (encoded) space and needs NON_LINEAR. Linear and specify Gamma modes calculate in linear light and need LINEAR. With LINEAR hardcoded, switching calculation space changed the graph display but had no effect on the actual image.
Also corrected: pointsX (raw ramp) was passed instead of pointsX2 (dRange-adjusted) to setup_curves_filter.
+            # TRCType must match the space the sigmoid was calculated in.
+            # Legacy: calculated in sRGB (encoded) space → NON_LINEAR.
+            # Linear / specify Gamma: calculated in linear light → LINEAR.
+            trc = Gimp.TRCType.LINEAR if self.linear else Gimp.TRCType.NON_LINEAR
             curves_filter = setup_curves_filter(
                 self.layer, self.channel,
-                pointsX, pointsY, Gimp.TRCType.LINEAR, filterName)
+                pointsX2, pointsY, trc, filterName)
Bug 5 — Graph X axis did not reflect dRange adjustment
The display graph was passing pointsX (unadjusted) instead of pointsX2 to
update_data, so the graph didn’t show the flat regions at the black and white point limits. A photographer needs to see exactly what the curve is doing to their image.
         if self.linear == True and self.dispmode == mTrans["LBL_DISPMODE1"]:
-            pointsX_disp = [linearToSrgb(p) for p in pointsX]
+            pointsX_disp = [linearToSrgb(p) for p in pointsX2]
             pointsY_disp = [linearToSrgb(p) for p in pointsY]
         elif self.linear == False and self.dispmode == mTrans["LBL_DISPMODE2"]:
-            pointsX_disp = [srgbToLinear(p) for p in pointsX]
+            pointsX_disp = [srgbToLinear(p) for p in pointsX2]
             pointsY_disp = [srgbToLinear(p) for p in pointsY]
         else:
             pointsY_disp = pointsY
-            pointsX_disp = pointsX
+            pointsX_disp = pointsX2
Bug 6 — Inflection Point marker in graph was not inverted
After fixing the slider direction, the tick mark on the graph X axis still drew at the old (uninverted) position.
         if self.dispmode == mTrans["LBL_DISPMODE1"]:
-            g_sp = 40 + (width - 10 - 40) * self.sp / 100
+            g_sp = 40 + (width - 10 - 40) * (1.0 - self.sp / 100)
         else:
-            g_sp = 40 + (width - 10 - 40) * srgbToLinear(self.sp / 100)
+            g_sp = 40 + (width - 10 - 40) * srgbToLinear(1.0 - self.sp / 100)
Bug 7 — TP_IP tooltip silently truncated (syntax error)
A missing backslash on the second line of the TP_IP string caused Python to silently discard everything after the first two lines. Also took the opportunity to rewrite the tooltip in photographer-friendly language.
-    TP_IP = "50.0: Apply a symmetric S shape curve.\n"\
-        + "0.0: Apply an upward curve.\n"
-        + "100.0: Apply an downward curve.\n"
-        + "under 50.0: Apply an s-curve with a high upward proportion.\n"
-        + "over 50.0: Apply an s-curve with a high downward proportion.\n"
-        + "The symmetry here is based on perceptual color space.",
+    TP_IP = "Controls where the contrast boost is centred.\n"\
+        + "50: symmetric s-curve (equal shadow and highlight contrast).\n"\
+        + "Below 50: more contrast in shadows.\n"\
+        + "Above 50: more contrast in highlights.",
Bug 8 — dead initialisation of self.contrast
self.contrast = 0.1 was set and immediately overwritten by self.contrast = 0.0 a few lines later. The 0.1 line is dead code and was removed.
-        self.contrast = 0.1  # Default value for scale1
         self.sp = 50.0
         self.darkest = 0.0
         self.brightest = 100.0
After all those fixes the plugin behaves correctly across all three calculation
spaces, the inflection point slider direction matches its tooltip, the graph
accurately reflects what is applied to the image, and legacy vs linear modes
produce visibly different results as intended. Tested on a 16-bit non-linear
sRGB image in GIMP 3.2.4 on Ubuntu 26.04.