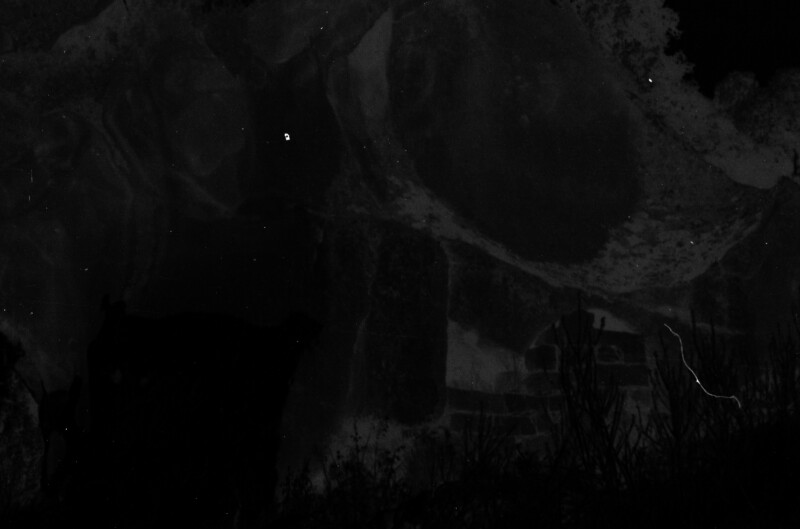
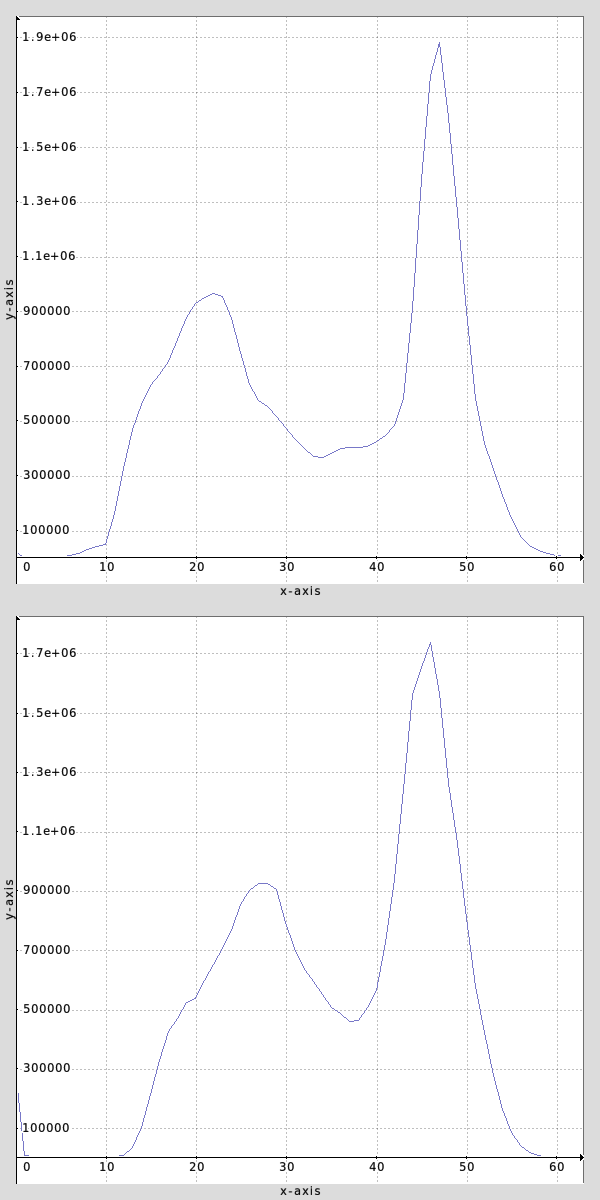
For me, unfortunately, the correlation is not liniar (Nikon Coolscan ED 5000).
As both IR and Red channels are liniar (raw data from Vuescan), it also doesn’t make much sence to “log” red channel.
- Attached are the translation curves from Red to IR for 3 differend negatives (1,2,3 - liniar) - (1r, 2r, 3r - Red channel Loged).
I guess, it’s about different exposures (gain) per channel and a lot of underexposed area with noise on the left side of the curve.
I’ve tried different solution (RGBA tiff):
gmic.exe
1.tif
split[-1] c
rm[-2,-3] #keep only Red and Alpha channels
[-2] [-2] #copying both for further operations
crop[-1,-2] 5%,5%,95%,95% #cutting borders from copies
command andy_kelday gcd_mean_transfer_curve[-2,-1] #calculating the Red to IR transfer curve
rm[-2] #deleting copy of red channel
[-1] # copy of IR is replaced by GCD funcion, with transfer curve data - copying it
+resize[-1] 100%,0.15%,100%,100%,2 #averaging the curve (2) and making less points to a new position
crop[-3] 0,0,0,0 #getting the leftmost point of the curve
crop[-2] 0,100%,0,100% #getting the rightmost point of the curve
append[-3] [-1],y #these two lines merge the points of the curve
append[-3] [-2],y
rm[-1,-2] # removing temp data
split[-1] c # these three lines reallocate Y value of the curve to the same channel
append[-2] [-1],x
rm[-1]
apply_curve[-3] 1,{-1,^} # applying averaged transfer curve to original Red channel
rm[-1] # removing transfer curve, so only Transferred Red and IR uncut channels are left
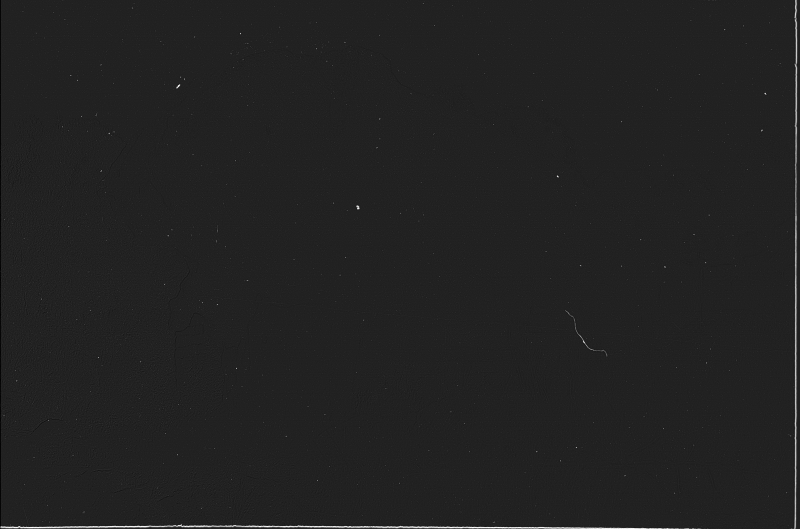
sub[-1] [-2] # subtraction of transferred Red from IR
It provides quite good results.
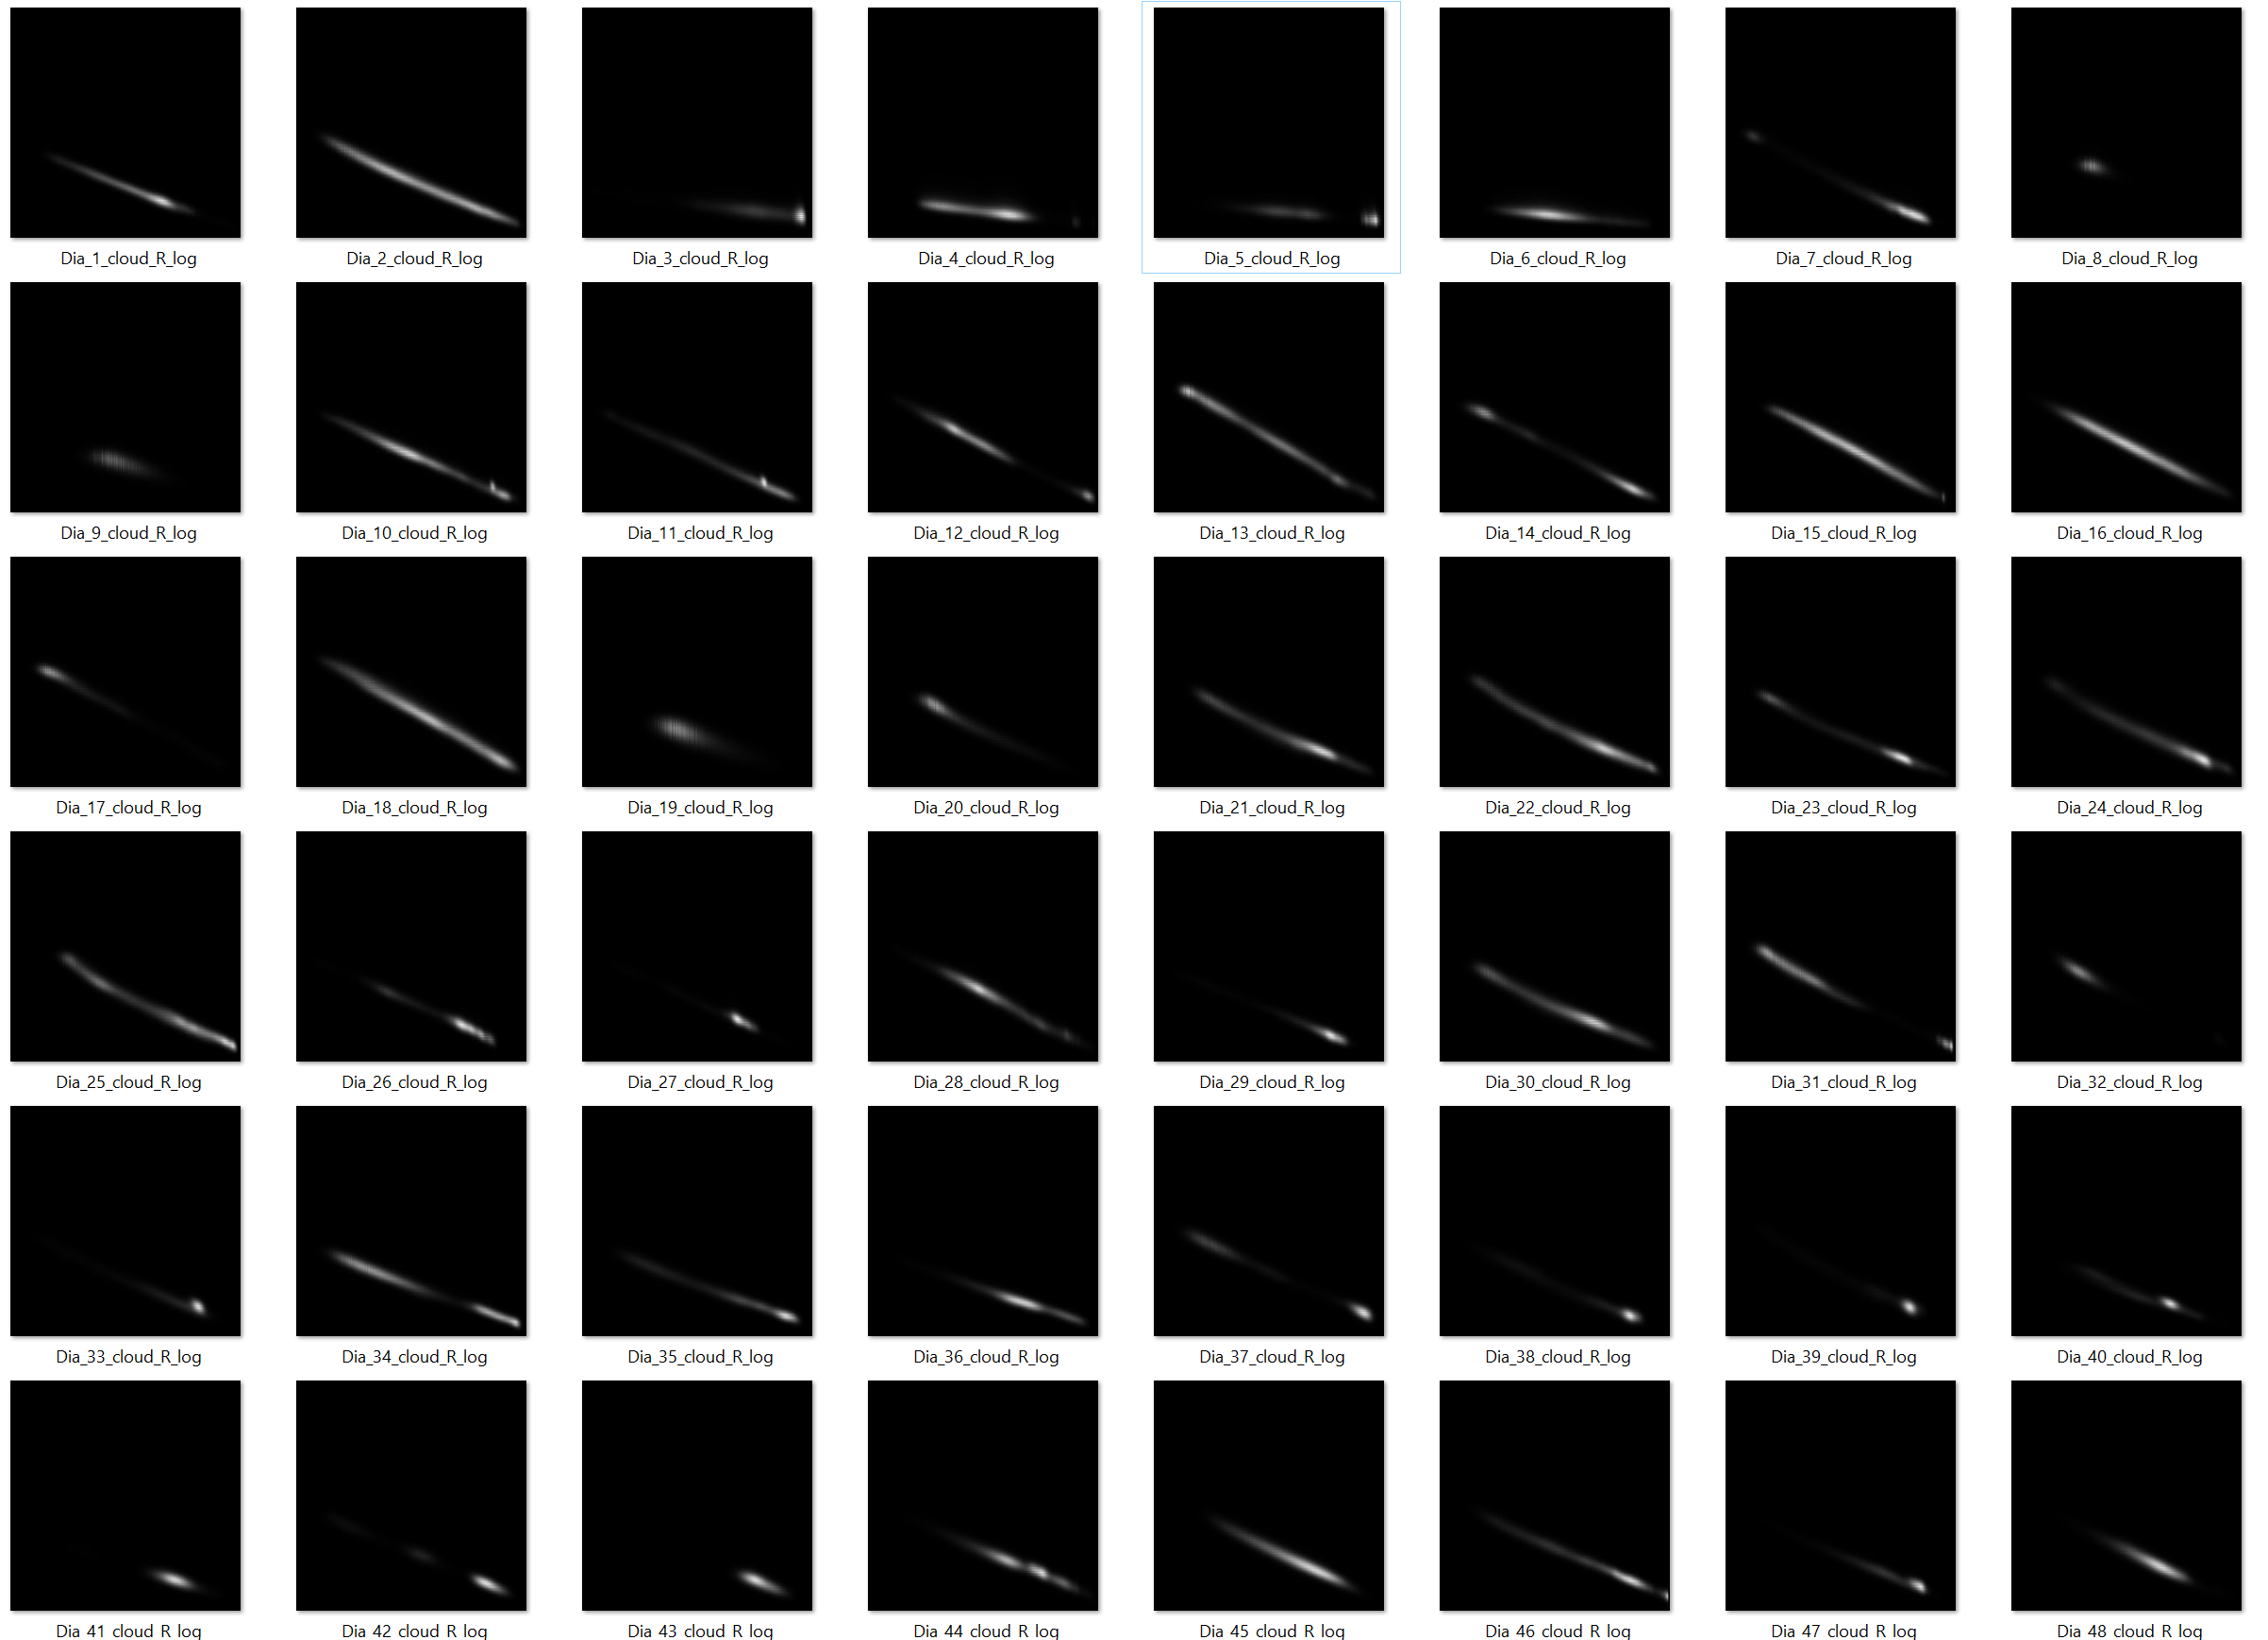
Though I stuck with generating a clear defect map because of noise (it is a real barrier). I assume, some “credibility” mask should be applied as well (https://citeseerx.ist.psu.edu/viewdoc/download?doi=10.1.1.408.6190&rep=rep1&type=pdf).
However, I haven’t tried it, yet.