Hi everyone
I’m using a canon 700d.
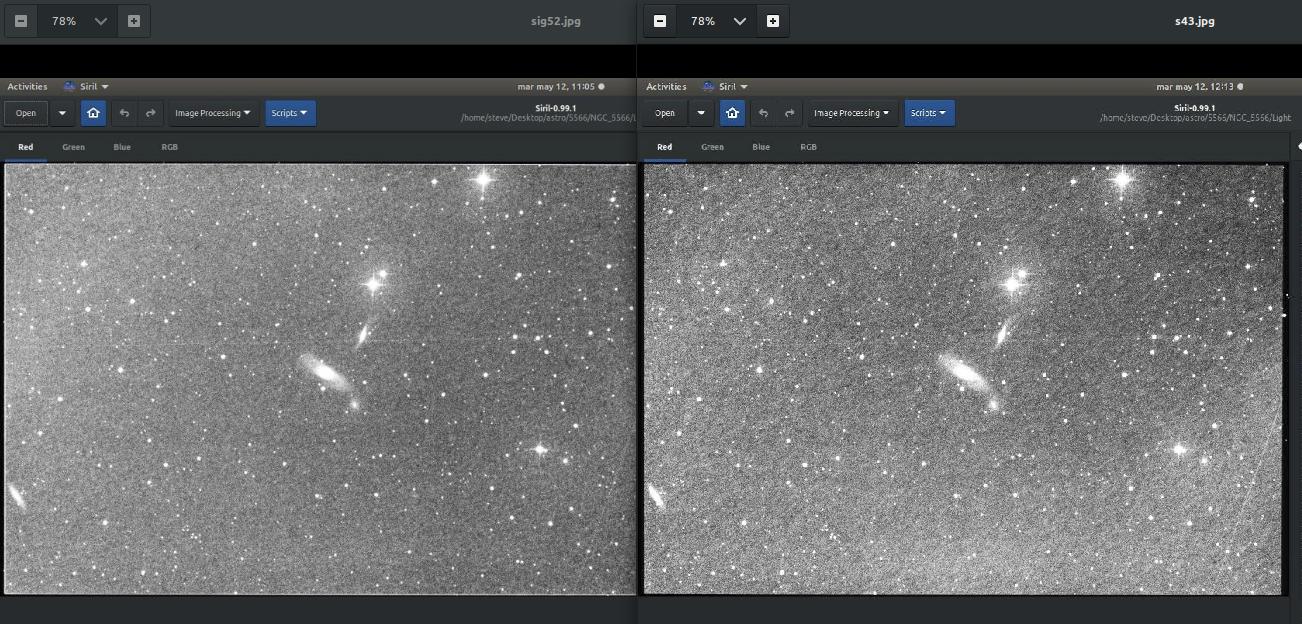
The stack using sigma clipping 5-2 has much less noise than the default 4-3.
Could anyone give me an (easy if possible) explanation as to what the numbers mean?
The 4-3 leaves almost impossible to process background blotches.
TIA,
Steve
histogram stretches for comparison

I’m not entirely sure which numbers you are referring to but I guess you are referring to sigmaMin/sigmaMax. With those numbers you define the ‘cut off point’ at which a pixel is considered an outlier in standard deviations and will not be used for stacking.
If you want the details:
1 Like
Hi and thanks for your reply.
Yes, they are the values which are entered as outlined below. Unfortunately i’m not a coder at anything like this level.
i was looking for an explanation of what the numbers do to an image. e.g. what do i lose by stacking 5-2 rather than the default 4-3. (There seems nothing obvious visually)
TIA,
Steve

If you make these values bigger you will exclude fewer outliers. With 5 sigma you will likely just turn it into a straight average unless you deal with a humongous stack or a sensor with an extremely skewed distribution.
So if you for instance have a plane flying across your frame or satellite passing through etc. that might not be removed and leave a visible ‘ghost’. For deeper imaging/longer focal length turbulence might also be a factor but I have little experience with that.
I don’t have hard data regarding this but I only use outlier rejection when I have an actual reason to (the planes and satellites mentioned above, a fly flying in front of the lens or something among those lines), if the shots are clean, I see little reason not to use all the ancient photons you captured in the final result.
2 Likes
could you try to stack without sigma clipping? So let SiriL average all the pixels and see if the result are better or worse. By the way, what a fantastic M13’s portrait 
Thanks for the reply. Yeah, we had steady enough seeing for 1200mm focal length. It doesn’t happen that often. When it does my first choice is the old sw blue tube 10".
The clipping algorithms are still a mystery to me. I can’t find a non technical explanation of what the numbers do.
I tried both sum and median but the results both give more noise compared with the -seemingly magical- sigma clipping with high 2 low 5.
Cheers,
Steve
Median and sum (as implemented in siril for this latter) will always give more noise than average integration.
The linear fit clipping is well designed for large set of data.
Linear fit clipping? With what values? I see that the default is 1 1. What do the numbers mean? Say I have 40 light frames each of 5 minutes. What do I choose? The default 1 1 Linear fit gives more noise than sigma clipping 5 2.
Thanks
Default values are not 1 1, but something like 5 2 or 5 5. I do not remember.
Well the sigma clipping is not to difficult to understand. Let me try to explain it: after aligning all the frames you consider each pixel individually. For each pixel on the image you have a “column” or “pile” of the same pixel location on each aligned frame. On an ideal world all those pixel should be identifícalo, by you know, the noise make los that this value fluctuate. We stack to average those fluctuations. The sigma clipping algorithm computes a first average and the standard deviation around this average value. This SD is a measure of how packed the data is around the average. We will call this desviation sigma. Then, on a second pass we reject all the pixels that are more separated from the average value. How much? By the numerical factors that you have changed “times” the sigma. Once those values are rejected the process is repeated until the process converges and no more pixels are removed. This is performed on every location of your image.
1 Like

Sigmas are standard deviations from the average.
1 Like
Hi and thanks for the explanations.
Still thinking…
Here are two other examples where i set a random 6 pixel dither between each of 64 frames of 5 minutes. Notice that neither sigma 5 2 nor the default sigma 4 3 remove the satellite trails but that once again, the sigma 5 2 yields the least noise.
Dither: the amount may have something to do with this. I’m using EKOS and phd2. the dither amounts are from -6 to + 6 in a random direction. This is working as I can see the values passed from the phd2 log. I’m using a canon eos 700. Any advice on settings? do I need a larger dither for the eos maybe!
Screenshot from 2020-05-12 12-51-14|690x330
Hi alacam, I too am looking for a “symptom: xxx? solution: sss” approach. That would include a “turning R up to 5 gives the benefit of …, but introduces a side effect of …”
Clipping affects noise indirectly - there is not a simple slider/dial to control. Expanding on Rafa’s good explanation with a population demographics analogy: a row of pixels from dark nebula to a star is a series of rooms in a hospital from babies through kids, adolescent, young, middle-aged, senior, old. But you asked people to sort themselves, which gives you noise: some seniors put themselves in the middle-aged group, some adolescent call themselves young and so on. The more people in the room, the closer the average age gets to the middle value you expect. While averaging gets you a decent answer, clipping says "hang on, you at 100 (say a satellite) and you at 0 (dead pixel) obviously should not be part of this, so I am clipping you out of the calculation, giving me a truer/cleaner average value. A large sigma (5) means you are including kids and seniors in the young category (astro-wise this could be a including a thin passing cloud dropping the value). So why not have a small sigma (1) to be sure you are excluding the extremes? You then have a room with 3 people, whose average might be 25. The row of pixels below with 3 people in their room gives 45, and the row above that gives 30 => means more noise (pixel to pixel change) in your final survey. The larger sigma guarantees a smoother change (less noise), but also guarantees you smooth out real fine scale detail (blurr in the wisps in the Merope nebula). So it may make sense to have a lower value for upper range to be be sure you exclude satellites/planes, but a bigger value for the bottom to include thin clouds fading your target a bit. A trade-off! And very much an individual taste thing which is why you can’t find recommended values easily.
But that is an analogy that only goes so far…
The trick in your experiments is to keep good records. You may find that for globulars you have a different set of numbers than for dark nebulas, than for bright ones.
Regards,
Alister.
Thanks Alister
That’s a nice easy to follow analogy.
In Siril, the low value is 5, the high value is 2. Have I got that the right way around? That is the combination I find gives me the least noise but as you say, that’s for galaxy season. Also, it doesn’t remove satellite trails. Neither does the default 4 3. Neither does any of the 20 or do different combinations I’ve tried.
I’m thinking that I need to dither a greater distance between frames but stick with the 5 2 clipping.
Any ideas?
Cheers,
Steve
Hmmmm, maybe others with more processing experience can jump in.
You do have things the right way around. I would think that a high value of 2 would kill satellite trails - This is where close attention to values can identify bugs - sometimes it’s not you! But with the range of buttons, values, etc, it is easy to change a value that underneath is not even used. e.g. straight median method (no clipping) does not use clipping values, so changing them has no effect. It is so easy to have a box checked when it should not be and being frustrated, you don’t see it right in front of you.
My de-bugging approach requires patience, precision, and several tests with only one variable changing.
- Copy your images to a test directory so you don’t mix things up or have accidents.
- Crop ALL your images down to say 200 pixels on a side, in an area including the satellite trail. This will speed up the processing enormously as a benefit.
- Use an image program with the eye-dropper to find out the RGB values of the satellite trail and the nearby background. Hard numbers are useful.
- Start with say only 10 images. Does the trail vanish? Is it the same brightness as the single image.
a) compare to median (not sigma clipped). The trail should be there, but faint.
b) change back to sigma clipping and put the upper sigma clip to 1 and see.
c) go to 20 images. Any difference?
As an example using Standard Deviation Calculator, I input 6,7,8,9,10,11,12,13,10,100 where the “100” is a thought experiment satellite.
Mean, μ [mu]: 18.6 Standard Deviation, σ [sigma]: 27.2
So, relative to the mean, the 100 is [ (100 - mu)/sigma] or 2.99 standard deviations away. So if our upper sigma is set at 3.0, the 100 would be included (surprise!), and your stacked pixel value would be 18.6. If we had set sigma to 2.5, the 100 would then get excluded, and the stacked pixel value would be 9.56 (average of 6,7,8,9,10,11,12,13,10) and the new sigma now a small 2.1. Any thing more than 2.5*sigma = 2.5 * 2.1 = 5.25 above the new mean of 9.56 [14.8] would get excluded.
I will leave you with just a bit more. Taking our example above, but making 20 values, of which only one is 100: 6,7,8,9,10,11,12,13,10,6,7,8,9,10,11,12,13,10,11,100
gives a mean (average) of 14.1 and a sigma of 19.8. Our 100 value is now
(100-14.1)/19.8 = 4.33 times sigma away from the average, which exceeds the original sigma clip of 3.0. So with no change in the original sigma clip value, but with more samples (light frames), the 100 really stands out as not belonging. A value of 80 would be tossed because our sample size is getting bigger and we have an improved idea what “normal” is.
Good luck with the experiments! The advantage of 10 samples is that you can extract the numbers and run it by hand.
Alister.
1 Like
@Alister Thanks so much. That is very well described. I’m getting there.
May I ask one more question?
Could you/anyone give me a one line explanation (e.g. like a mouse hover tool tip; there are none in Siril) for:
Sigma low
Sigma high
?
TIA and stay safe,
Steve
How about this…
Sigma low : 2 excludes outliers that are considerably darker than average for that pixel. 4 excludes only the extreme (trees).
Sigma high: 2 excludes outliers that are considerably brighter than average for that pixel. 4 excludes only the extreme flashes (3 may not exclude average satellites).
It’s not easy doing it short yet understandable. Sigma should be thought of as an expanded version of “10 give or take 2”. If sigma is 2, then a low sigma of 4 and high sigma of 3 is from 10-(4x2) to 10+(3x2) or 2 to 16 would be included.
Hi Alister and thanks so much for your patience.
Your description of high and low is excellent and I think it should be included in Siril as a tool- tip; there currently are none for the high low values.
None of the many 4-3, 5-2 etc combinations have yet removed satellite trails. I’m wondering if it’s because I haven’t dithered far enough between frames. That’s gonna be the next test I think.
Thanks again,
Steve
Satellite trails still with a high sigma of 2. Surprising… try a high sigma of 1, and double check that you are indeed using sigma clipping on your lights. Since there is a sigma clipping available on darks I’m mentioning that in case. Yet another possibility is if you are using scripts, they may be using their own default values. I am still new to Siril so am not sure. Good luck.
How many frames do you have?