Hmmmm, maybe others with more processing experience can jump in.
You do have things the right way around. I would think that a high value of 2 would kill satellite trails - This is where close attention to values can identify bugs - sometimes it’s not you! But with the range of buttons, values, etc, it is easy to change a value that underneath is not even used. e.g. straight median method (no clipping) does not use clipping values, so changing them has no effect. It is so easy to have a box checked when it should not be and being frustrated, you don’t see it right in front of you.
My de-bugging approach requires patience, precision, and several tests with only one variable changing.
- Copy your images to a test directory so you don’t mix things up or have accidents.
- Crop ALL your images down to say 200 pixels on a side, in an area including the satellite trail. This will speed up the processing enormously as a benefit.
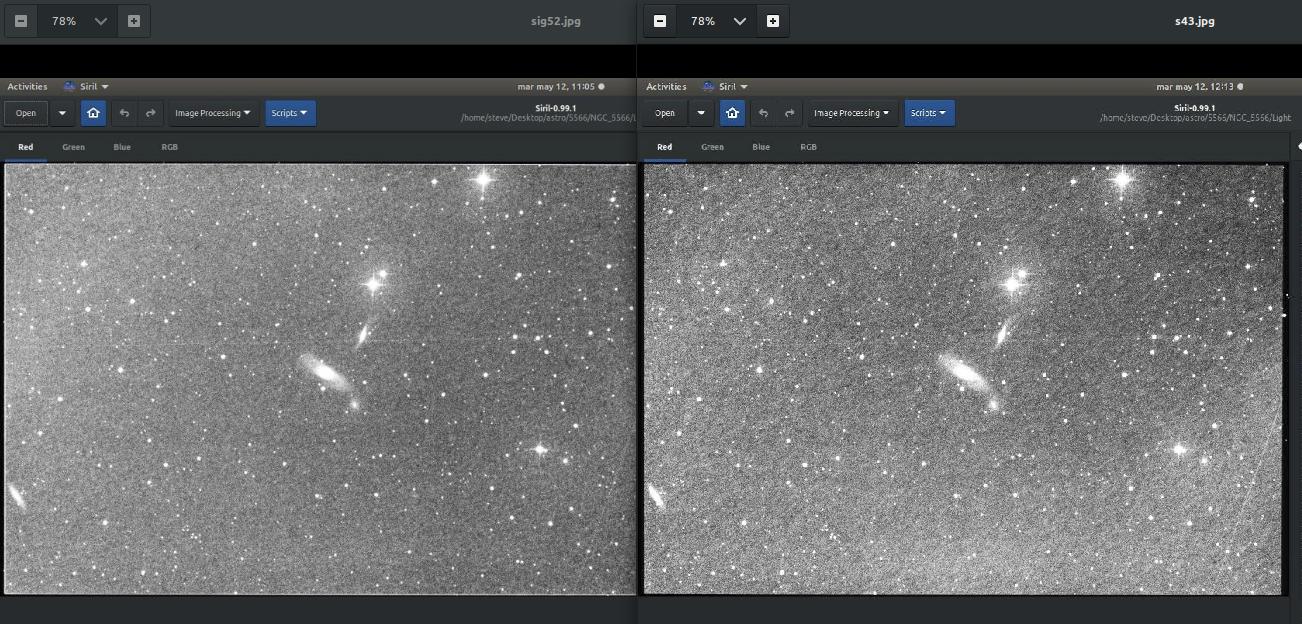
- Use an image program with the eye-dropper to find out the RGB values of the satellite trail and the nearby background. Hard numbers are useful.
- Start with say only 10 images. Does the trail vanish? Is it the same brightness as the single image.
a) compare to median (not sigma clipped). The trail should be there, but faint.
b) change back to sigma clipping and put the upper sigma clip to 1 and see.
c) go to 20 images. Any difference?
As an example using Standard Deviation Calculator, I input 6,7,8,9,10,11,12,13,10,100 where the “100” is a thought experiment satellite.
Mean, μ [mu]: 18.6 Standard Deviation, σ [sigma]: 27.2
So, relative to the mean, the 100 is [ (100 - mu)/sigma] or 2.99 standard deviations away. So if our upper sigma is set at 3.0, the 100 would be included (surprise!), and your stacked pixel value would be 18.6. If we had set sigma to 2.5, the 100 would then get excluded, and the stacked pixel value would be 9.56 (average of 6,7,8,9,10,11,12,13,10) and the new sigma now a small 2.1. Any thing more than 2.5*sigma = 2.5 * 2.1 = 5.25 above the new mean of 9.56 [14.8] would get excluded.
I will leave you with just a bit more. Taking our example above, but making 20 values, of which only one is 100: 6,7,8,9,10,11,12,13,10,6,7,8,9,10,11,12,13,10,11,100
gives a mean (average) of 14.1 and a sigma of 19.8. Our 100 value is now
(100-14.1)/19.8 = 4.33 times sigma away from the average, which exceeds the original sigma clip of 3.0. So with no change in the original sigma clip value, but with more samples (light frames), the 100 really stands out as not belonging. A value of 80 would be tossed because our sample size is getting bigger and we have an improved idea what “normal” is.
Good luck with the experiments! The advantage of 10 samples is that you can extract the numbers and run it by hand.
Alister.


