Hi all, while Siril is stacking my subs I can see the dx/dy numbers flying by. I’d really like to see a summary of this, is that possible and is it included in the results file by any chance? Ideally I’d like to see the histogram of distance, but a mean and stddev would also be good. Even better if it uses the focal length and pixel size to report this in arcsecs.
I’m doing RA tracking, no guiding, so I’m not getting this data from anywhere else.
OK thanks, that looks very useful. I’m using the predefined OSC scripts, so I guess I’ll need to create a manual sequence to be able to see this? Will that involve reprocessing or has the data already been cached as a result of the script?
you can display that by loading the registered sequence after the script ran: change working directory to process, in the Sequence tab click on Search sequences and select pp_light_.seq
Thanks! But when I do that the F5 / Plot tab doesn’t have anything in it and all the options are greyed out, is there something I am supposed to enable to see the registration stats?
Apologies for the very basic question, but how do I load a sequence beyond selecting it in the sequence selection? When I do that the image preview changes and it says “Sequence: pp_light_.seq 555/555 images selected” in the main window. I can’t find any other obvious button that would suggest loading the sequence any further. But there’s nothing in the Plot tab.
I thought maybe this was because I didn’t have gnuplot installed (yes, shame on me, it’s been almost 25 years since I last used it!) but installing and restarting did not make anything appear in the Plot tab. I’m pretty sure I’ve loaded the sequence, it takes some time to hit the disk and then something that looks like my light images shows up in the main viewer. I must be missing a step required to initialise the plotting feature.
If you did not removed any files you should be able to see a plot with the pp_ sequence in the process folder. If you don’t, maybe you removed the *.seq file.
the .seq files are all there. I’m able to select it in the “sequence selection” dialog (see above) and that seems to cause the sequence to load… but nothing shows up in the Plot tab
I’m currently processing my data from last night with the standard dual filter processing script, when that finishes I’ll take a look and see if Plot is populated after that.
I haven’t removed any files that I’m aware of for this data.
My script just completed for the data I acquired last night and I immediately set the working directory to process and scanned for sequences, then selected the pp_light_.seq which appears to have loaded it but still no data in the Plot tab
And to confirm that I have loaded the sequence, this is the stdout logging if I launch siril from the command line
Reading sequence file `pp_light_.seq'.
Purging previously saved reference frame data.
log: Reading FITS: file pp_light_00001.fit.fz, 1 layer(s), 6024x4024 pixels, 32 bits
bitpix for the sequence is set as -32
log: Sequence loaded: pp_light_ (1->636)
Purging previously saved reference frame data.
number of filtered-in images: 636
number of filtered-in images: 636
number of filtered-in images: 636
number of filtered-in images: 636
Saved the reference frame buffer for alignment preview.
It seems I actually need to be using the r_pp_light.seq, and of course, reading the script I understand that this is the sequence after align has been run so of course the data is not available until then.
I only have r_result.seq, which is too late because everything has been aligned already, but I’ll go and investigate why my r_pp_light.seq is not there.
after today’s run the pp_light.seq was there, I will try a full reprocess of earlier data after wiping the intermediate files and folders.
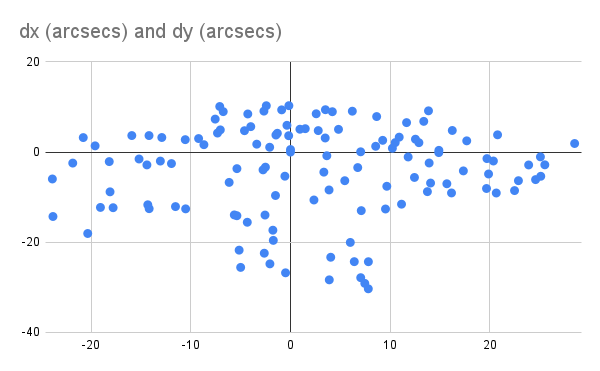
Exporting to CSV I’m able to plot the wobble the way I want (at least assuming that the frame ordering is not changed when I swap between showing X and Y)