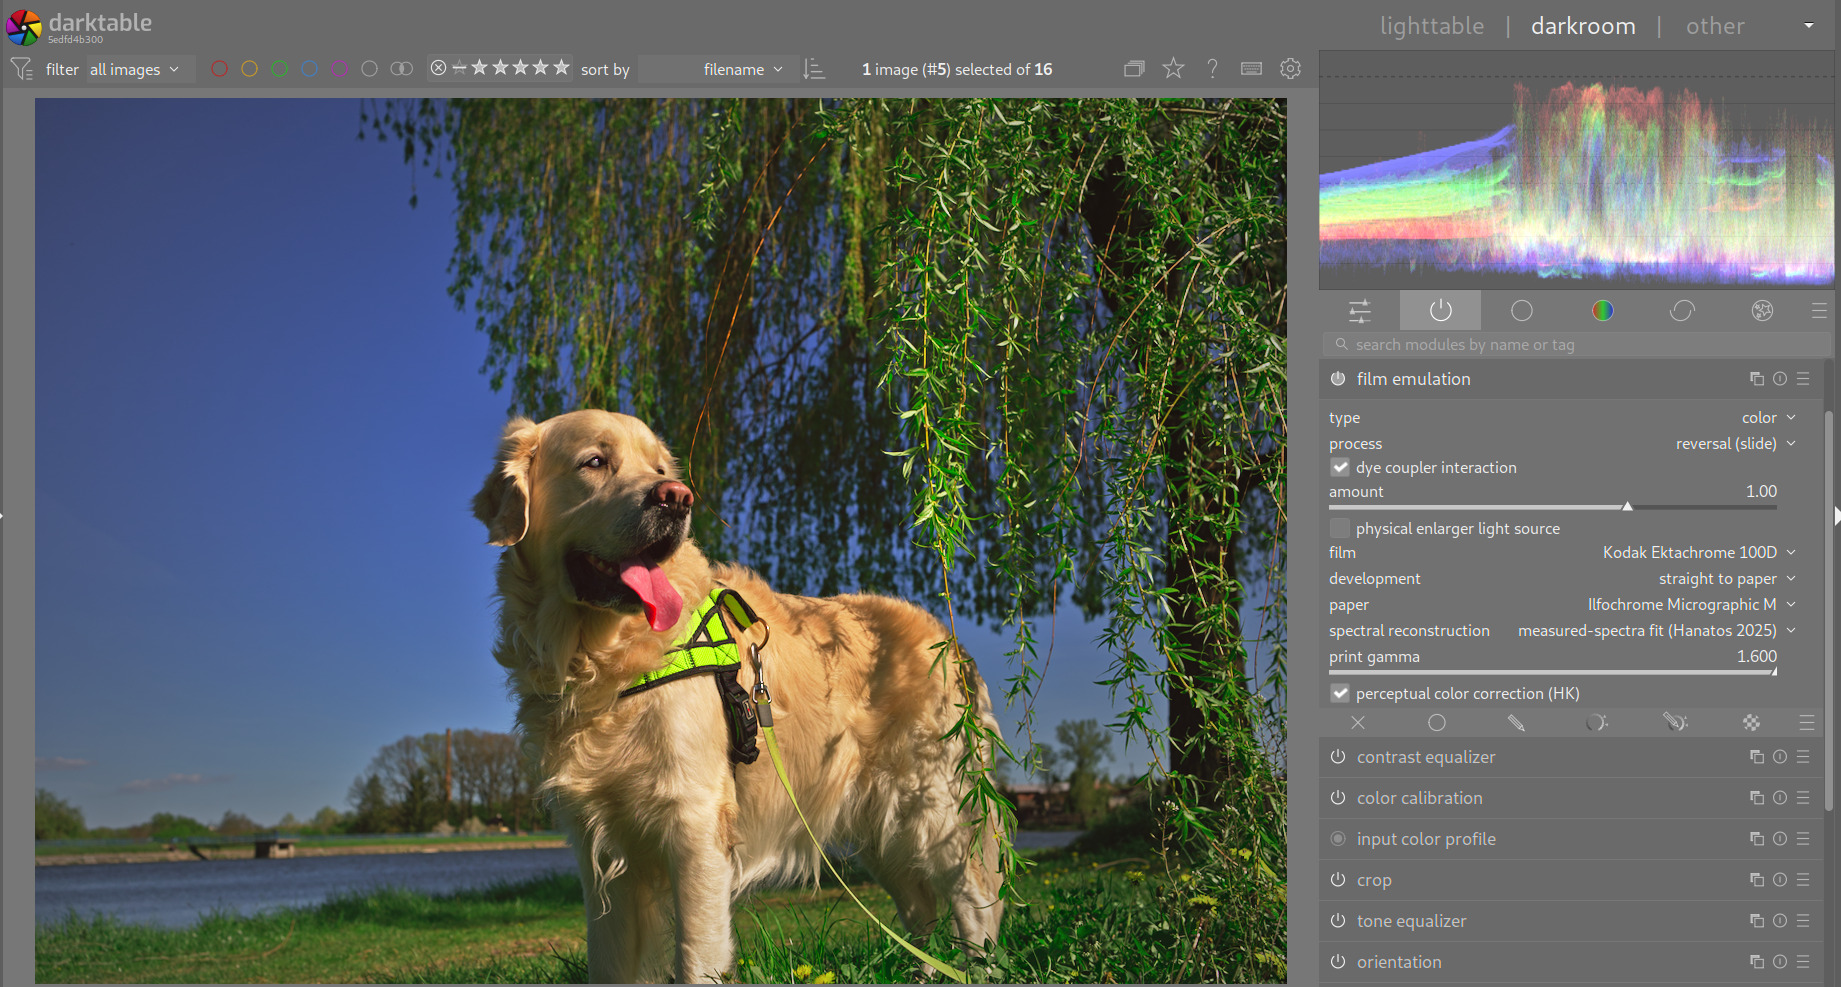
As some of you might have noticed, the focus of my tinkering with true to physics LUTs shifted to trying to create a tone mapper attempting to purely implement what film and paper does. Currently grabbing a lot of good ideas from spektrafilm. This is what it currently looks like:
The next step is long and tedious, and even though a lot of it was already done, it will take me ages alone. So I want to ask for your help to move this forward.
I’m extracting data from film and paper spec sheets. Collected them here (thanks to 125pix.com).
The results are here and the code doing the work here.
Yes, the code is all AI slop, I’m in the let’s get shit done mode, not in the write beautiful monadic code that can be shown on functional programming symposiums mode 
Anyway, I’m at the stage where I would start going through it one by one and yelling at the AI if something is missing. The debugging mechanism is based on generated data overlayed over PDF content, saved to an image file. Like below. As you can see, apparently we are not generating data for one of the charts.
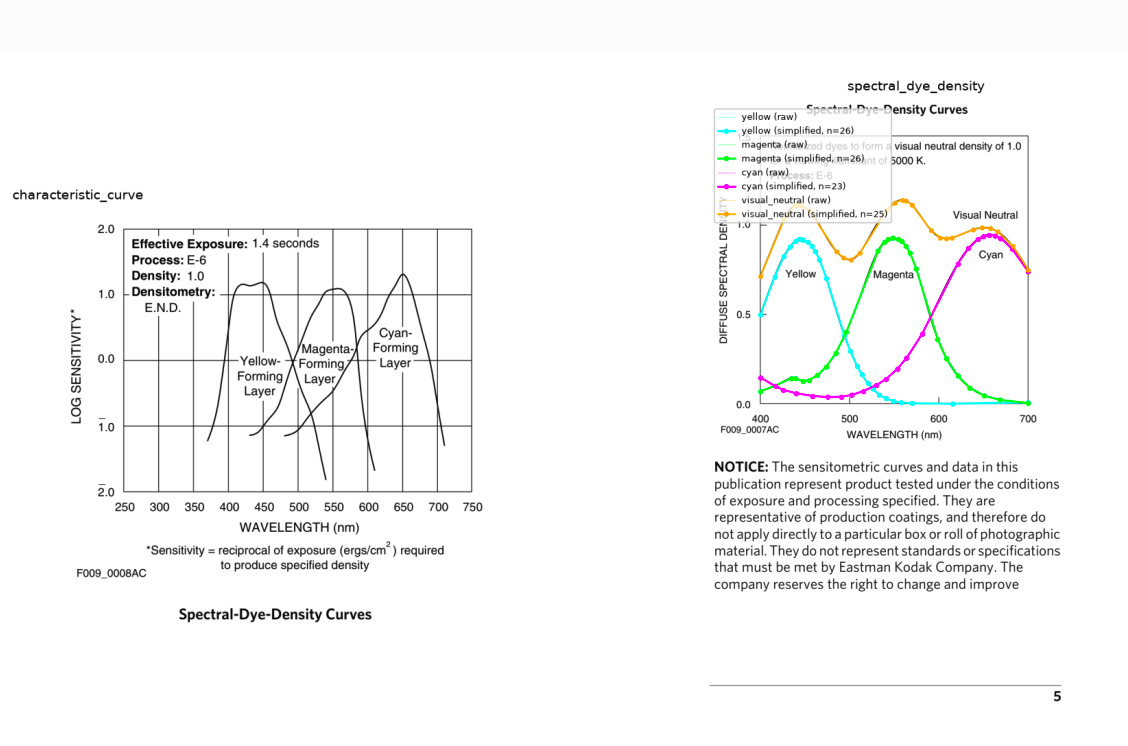
point is, I need the chart data extracted. What I know I need for now is
characteristic curves, spectral sensitivity, spectral dye density for color film. for black and white, spectral sensitivity, characteristic curves. For paper, again, characteristic curves, spectral sensitivity, spectral dye density.
Problem is… this starts feeling like it will take a year if I do it alone. Wanna help?

