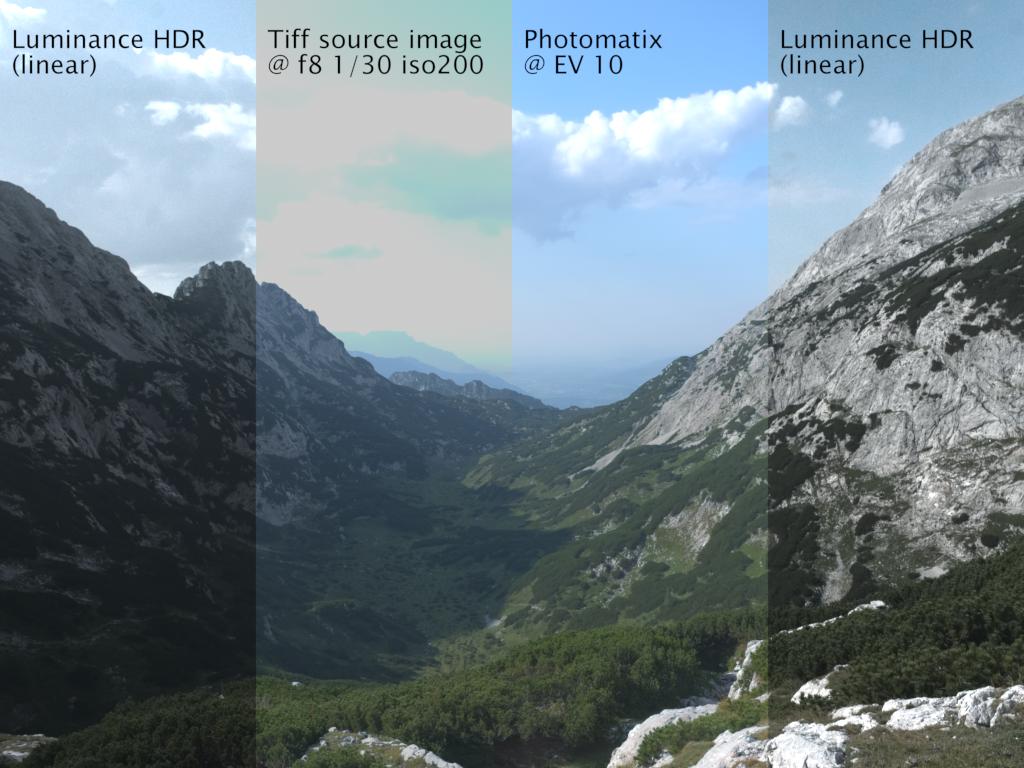
I hoped to answer some of your questions by verifying a few things empirically, but the only thing I managed to verify is that there are bugs afoot.
I believe the response of most cameras is linear. Some raw files contain a “raw curve”, which I suppose might result in the raw files being non-linear, though I haven’t verified whether this affects what you’re doing. I’d guess it does.
You’re capturing in whatever gamut your camera has. The colorspace setting in the camera affects only the embedded JPEG preview, not the raw file.
It should. There are two ways of doing this in RawTherapee 5.7:
- The old way, use the “Save Reference Image” button in the Color Management tool.
- The new and better way, use RawTherapee’s ICC Profile Creator to create a custom ICC profile with a linear gamma and whatever color space you need, e.g. ProPhoto, then save the resulting ICC file in the folder specified as the “Directory containing color profiles” in RawTherapee. Restart RawTherapee and the new ICC profile will become available as an output profile.
The resulting TIFF images appear correct when viewed in Geeqie without using a color profile - a TIFF saved using a ProPhoto gamma=1.0 output profile looks differently as expected when compared to one saved using a ProPhoto gamma=2.2 output profile. The actual pixel values are different and the profiles describe that, so when the images are viewed using the embedded profiles they look identical. So far so good.
Here’s where things get odd. I saved one bracketed set using an ICC v2 ProPhoto gamma=1.0 profile and one set using ICC v4 ProPhoto gamma=2.2, both using the ProPhoto working profile with TRC=none. I saved another set using ICC v4 ProPhoto gamma=2.2 and using the ProPhoto working profile with TRC gamma=2.2, slope=0. I created three HDRs, one from each set, using Luminace HDR v.2.6.0-249-g77752acd. I created camera response curves for each.
The resulting camera response curve files differed between each other in the “log10(response Ir)” column, but I haven’t succeeded in plotting a meaningful chart using LibreOffice. All three charts appear linear, here’s one:
!
tiff16ic_rtv4l_22.m.txt (412.2 KB) tiff16ic_lin.m.txt (412.2 KB)
I don’t know whether Luminance HDR is calculating the response curves correctly, and/or whether I’m charting them correctly. Would be good if you benchmarked against some third program, one which is known to calculate response curves correctly.
If anyone knows how to calculate camera response curves in a program which is known to work correctly in Linux, do tell.
16-bit integer TIFF, output profile ProPhoto, gamma=2.2: https://filebin.net/odkqnzb2zdialclk
16-bit integer TIFF, output profile ProPhoto, gamma=1.0: https://filebin.net/w44f6j4jag2tdjgr


