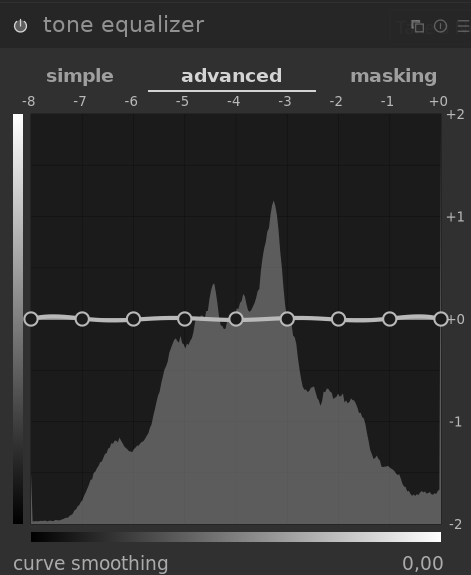
The histogram that is displayed in the advanced tab of the Tone Equalizer indicates a very narrow dynamic range despite the actual DR being far greater. This makes it difficult to adjust specific tone areas.
For myself I prefer to work with the advanced tab plus the histogram than the simple basic sliders.
Morning, David,
Info here:
Have fun!
Claes in Lund, Sweden
2 Likes
Also, it may not satisfy you, but I think it explains the reason:
1 Like
Hi Claes
Still frustrated with the histogram in this module. Here is an example. The image has a very wide DR, as is seen in the main histogram, but in the TE the histogram is so narrow that it is almost impossible to make any kind of subtle changes.

More often than not I need to use the rgb-curve to ‘tweek’ the fine details. It appears too me that the TE histogram is simply not being correctly displayed/stretched.
David
Swift reply: you need to alter your settings in the masking tab.
1 Like
Problem
solved … thank you … definitely need to read the book!!!
David
Evening, David,
… and now with screen dumps:

Note the adjusted mask exposure compensation.
The grey bar just above it reports the “width”.
And that setting results in this histogram:
Have fun!
Claes in Lund, Sweden
1 Like
Finally got it!
Thanks
1 Like
A further question Claes (in Lund) …
The settings that you show do spread the histogram correctly and I am getting better control but the histogram amplitude is almost lost … see clip. Is there some trick in being able to pull the values up so they are more usable?

Thanks
David … in Soglio
Grüezie David,
Start with the masking tab.
Turn the display exposure mask on.
Carefully read the help text that pops up when you hoover over a setting and decide what is the proper thing to do in your case.
In the beginning, set preserve details to no. That will turn many sliders off, so you won’t get distracted by them.
Have fun!
Claes in Lund, Sweden
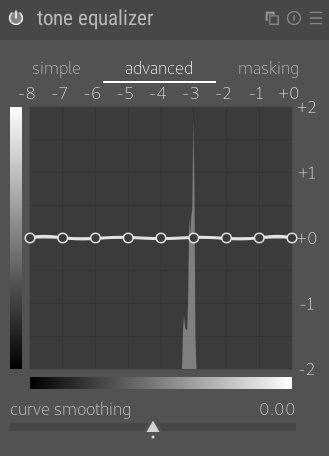
I think this is because your mask settings are clipping on the high end. (Note the very narrow spike at the right edge of the histogram.) The histogram magnitudes are scaled to the largest values. If you adjust your mask settings down a bit, you should see your histogram values in the midrange increase.
Edit: There may also be clipping on the low end. I can’t tell for sure if the gray vertical line at the left of the histogram is part of the histogram or the window. But I think it’s in the histogram.

In case you don’t want to lose time tweaking them, just:
- click twice on the colour picker of the mask exposure compensation (once to reset the value, then once to automatically center the histogram on the -4 EV channel)
- click twice on the colour picker of the mask contrast compensation (once to reset the value, then once to automatically spread the first and last deciles of the histogram between -7EV and - 1 EV)
- display the exposure mask to ensure you get a proper mask (not all black, but not all white). The mask display is there to help you understand what’s going on inside.
Also, as of darktable 3.0rc1, the histogram clipping will be explicitly be shown in graph (for highlights and lowlights) with danger signs:

Finally, notice that the histogram represents the exposure mask used internally. It doesn’t mean that the actual output RGB values will be clipped. If you clipped the lowlights, for example, it just means that the pixels darker than -8EV will get the same exposure correction as the -8EV ones, so you just lost precise control over them, but you will still preserve the gradients in there.
4 Likes
Using the double clicks (twice) does appear helpful on some images but in the example below the resulting histogram really provides no guidance at all with an image that has a very wide DR.
The thing is it depends very little on the actual DR of the picture, but rather on how heavy you blur the mask. In this case, maybe use the “preserve details” options set to “averaged guided filter”.
1 Like
Thanks. I was searching the same topic. Just thought that TE’s histogram should represent picture’s dynamic range, coast to coast. Now I can make TE working on whole pic’s range, not “compressing” it to unusable 2-3 stops.