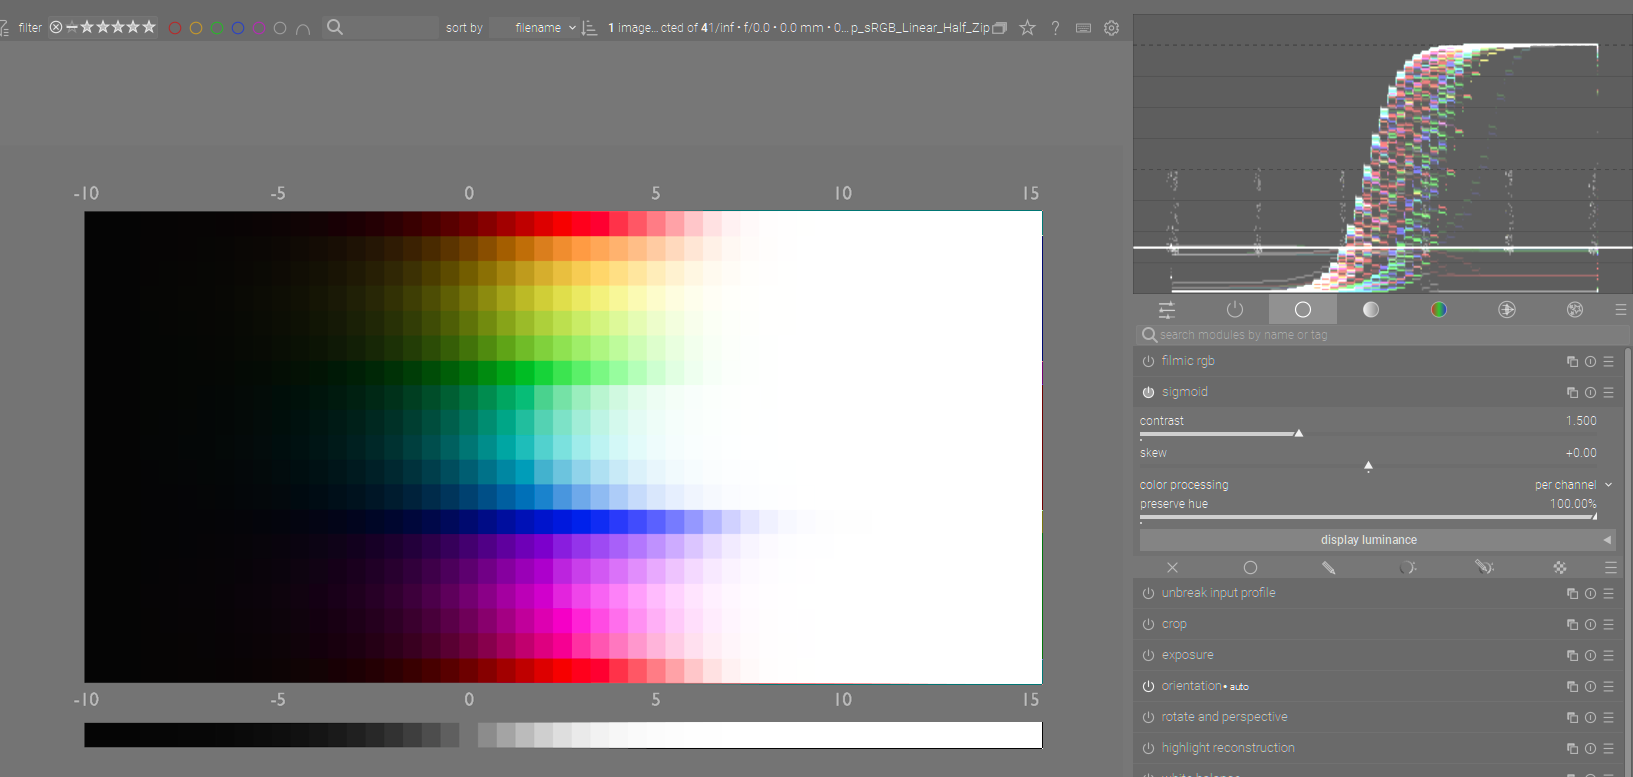
This image from Troy Sobotka’s test images is a great way to visualize sigmoid and fimilic module corrections. You can run through all the sliders and settings and compare the visual to what is essentially the curve by setting your histogram to waveform… Try sliders at their extremes to really see how it moves the data… even a simple switch in sigmoid from per channel to rgb ratio show the dramatic difference you get with the two settings… both on the image and the data as reflected in the waveform… Change the contrast sliders, the relative white in filmic…crank it up and watch it reel in the highlights…
Anyway I thought it might be a nice visual esp for people new to DT and trying to understand how the tonemapper fit into the DT workflow and how they are used with exposure to perform scene referred edits…
Add CC in bypass and with the default gamut compression set to 1… infact I noticed that dropping it to zero did seem to disable it but the smallest increment that you can add on the slider had a fairly large effect…
So in some ways its only a test image but I wonder if as it looks it might be nice to help an image if no sigmoid or filmic is added but the tonemappers seem to do a good job taking it out to white and the default CC pulls it back … I might try a few images and use zero if I am using CC and see if I feel like its better or not??