Because the primaries tab takes more place.
3 Likes
The changes have been merged. Note that, due to technical limitations, you’ll have to use the camera icon if you wish to have exposure limits estimated based on exposure parameters. The good news is that all adjustments (from the first enabled, preferably unmasked) instance of exposure (including manually set values and the recently added camera highlight preservation compensation) will be taken into account.
The behaviour of the pivot y picker has changed, it no longer uses the fixed 18% as baseline. This will better preserve brightness in most cases, but may cause changes if the area you pick has abrupt changes in brightness, so best use it on homogeneous surfaces.
There will be no more changes until the release is out, unless bugs are reported. I’ll start updating the user manual.
18 Likes
4 Likes
Concerning the new pivot relative exposure: is it intentional that the position of the indicator within its slider moves with changing relative white and black exposure? I find that somewhat confusing.
Since it’s set in EV, it has to move. Previously, it was set as a ratio of the distance between mid-grey and white (or black). You adjusted the black/white exposure, and you pivot, the tonal value of highest contrast, shifted from whatever you had selected. Now it stays at the same tonal value, and, as a result, the ratio changes.
BTW, that’s one of the things described in the manual, one of the new changes there. Please read the manual, and help me improve it.
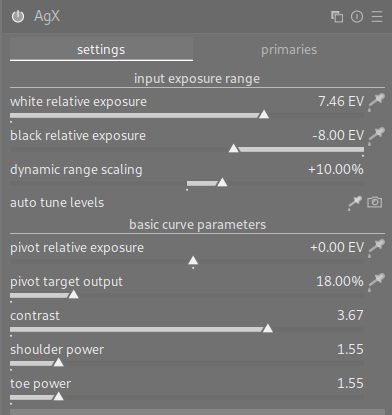
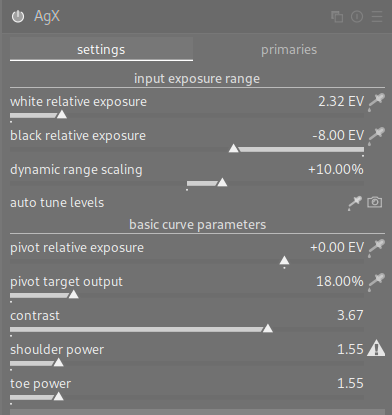
(And it was also changing before the recent modifications: with a black relative exposure of -8 EV and white at about +7.5 EV, mid-grey is almost in the middle. With white at only slightly above 2 EV, mid-grey is much closer to white than to black.)
1 Like
Thanks - I actually read the manual before posting here.
“[…] When adjusting the black/white relative exposure values, the pivot relative exposure (its distance to mid-gray) will be maintained, as long as possible. This will cause it to move along the x-axis, […]”
It wasn’t clear to me whether this meant “moves in a technical sense” or “in the UI”.
Is it technically possible for the triangle to remain in the center of the slider? From a UX perspective I find it makes sense to have it remain in the same place (also considering the numerical value remains the same).
No, it’s not possible. It doesn’t just move on the UI: it changes the parameterization of the curve.
Will do. I just wanted to say what a fantastic job you’ve done. Really enjoying the module.
2 Likes
Could someone please link the latest AgX video that Boris made. The one where he did multiple photo edits
Try this
6 Likes
When you have time, can you elaborate on this? The slides moving based on another slide moving feels odd. I’m reading from your post that the slide represents the ratio instead of the actual ev value.
Please forget now, for a while, whether the distance is in absolute EV or some ratio. Let’s forget about moving the pivot from mid-grey; let’s just check what happens to mid-grey itself.
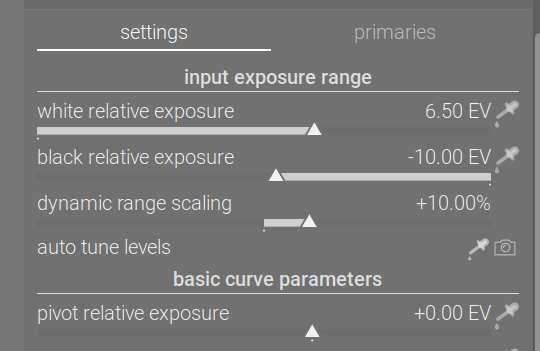
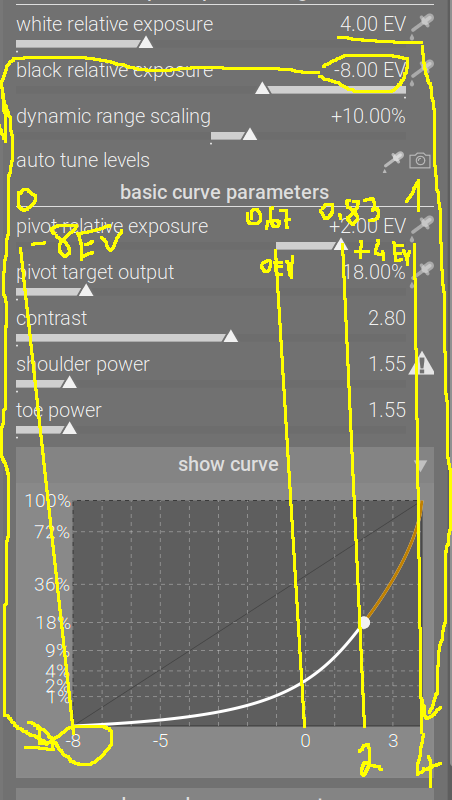
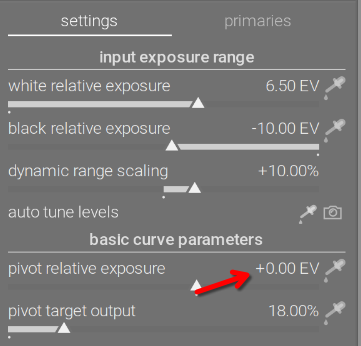
When you start, black relative exposure is at -10 EV; white is at +6.5 EV. The range is 16.5 EV, 10 to the left, 6.5 to the right of mid-grey:
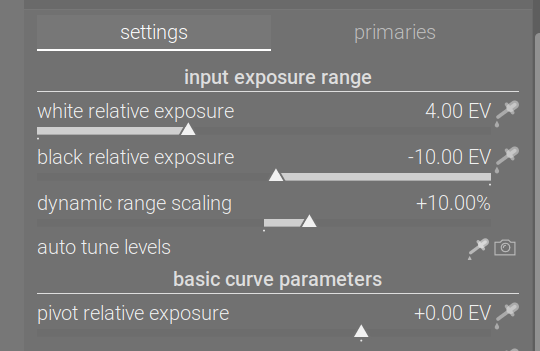
If you now change the white relative exposure to 4 EV, the range will change to 14 EV, 10 to the left, 4 to the right of mid-grey. However, the x-axis is the same, it still runs from 0 to 1; the meaning of those values has, however, changed: 0 still means -10 EV (10 EV below mid-grey), but 1 means 4, not 6.5 EV above mid-grey. As a result, the mid-grey pivot will be moved closer to the right (1) end of the range:
With that out of the way, let’s see what happens if the pivot is not at mid-grey.
The pivot’s x-coordinate used to be set via a ratio of the distance between mid-grey and white or black. A value of 50% meant placing it halfway between mid-grey and white, a value of -50% meant placing it halfway between mid-grey and black.
Suppose you picked the pivot using the picker, selecting the area where you wanted contrast to be the highest. Suppose you had your black and white exposures at the default -10 and +6.5 EV, and the spot you selected for the pivot was 1.95 EV above mid-grey. This was then turned into ‘30% the distance between mid-grey and white’, because 1.95 EV / 6.5 EV (mid-grey to pivot / mid-grey to white) = 30%.
If you subsequently moved the white point to 4 EV, it meant the pivot shifted to 4 EV * 30% = 1.2 EV above mid-grey. It no longer corresponded to the input you had selected using the picker.
With the latest code, the pivot’s representation will be recalculated, as the range changes, to reflect not only where mid-grey falls on the x-axis, but also to keep the absolute EV distance from mid-grey (for example, to keep 1.95 EV). On the 0…1 scale, it will be moved from 11.95 / 16.5 (10 EV between black and mid-grey, and then 1.95 EV above that to the pivot / total range of (10 EV + 6.5 EV)) = 0.7242 to 11.95 / 14 (10 EV between black and mid-grey, and then 1.95 EV above that to the pivot / total range of (10 EV + 4 EV)) = 0.8536.
2 Likes
Thanks for explaining this in detail. I never thought of it before, but I think the slider’s behavior is fine and to me also quite intuitive (well, what’s intuitive…) or in other words: it makes sense and illustrates the x-coordinate very well in the context of changing white- and black-point. You always know how much “head-” or “foot-room” you currently have with respect to middle-gray. Works well for me.
Thanks for the reply. I fully understand the math approach and I fully agree with it. My question/feedback is that the current behavior of the slide triangle is like it is a visual graph of the pivot point. It no longer represents value shown in the right side (+0.00 EV in your images).
I’m not sure I get what you mean. Internally, the value of the pivot’s x-coordinate is stored (0…1), but that’s a technical detail users should not be aware of / concerned with. Using visualisation parameters, it is presented to the user as the distance of the pivot from mid-grey, in EV (just like the x-axis itself is labelled in EV).
1 Like
A test build, as I found a crash when entering the darkroom. I saw some UI glitches in the initial fixed version (UI not properly drawn, toe/shoulder warnings not painted or not updated when switching between images), but I think I managed to fix them.
Update: no, I did not: resetting the module does not redraw the curve.
Update2: hopefully fixed for good now, see build 890~g1ef7e76649.
A PR is already open:
The Linux AppImage is here: https://tech.kovacs-telekes.org/dt-agx/Darktable-5.3.0%2B890~g1ef7e76649-x86_64.AppImage
It’s based on the current master, and thus has all fixes and updates up to and including gac95ecda:
commit ac95ecda2332c3d0b75c59905b0f37a2d10bd9fd
Author: Pascal Obry <pascal@obry.net>
Date:   Sat Nov 15 19:12:41 2025 +0100

    Fix crash in style dialog after previous refactoring.

    Fixes #19748
The branch, in case you want to build it yourself, is GitHub - kofa73/darktable at fix-agx-init-crash (kofa73:fix-agx-init-crash). @Dave22152 , @priort , @MStraeten , if you could update your builds, it would be helpful for testing.
I’d appreciate if people could give it a try. The database, module version etc. are the same as on master, so no incompatibilities are expected.
2 Likes
Note that there’s an issue visualising the history, a kind of technical limitation. I’ve logged it here:
I’ll have to wait for the opinions of the core devs, as I don’t think there’s an easy fix to this.
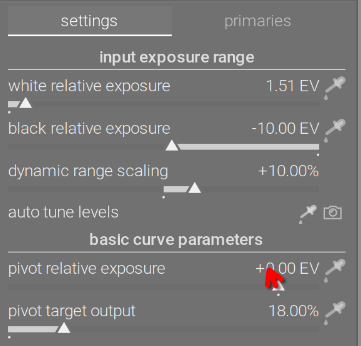
What I mean is that most (I think all) slides in dt represent the value shown on the right. This slide is not doing that. It represents the value based on a shifting scale. In your example it represents a scale of -8 to 4EV. It is not longer a slide, but a linear graph of the x axis of the curve.
In my opinion it is not a good user experience to have a slide moving around based on another slide. In my opinion, the triangle should remain in the center of the slide when the value = 0 EV. If someone wants to see the pivot, they can click the show curve.
In my screenshot below, the only thing I change was the white point. Again, I fully agree and understand the math, my feedback is only around the UI.
2 Likes
Yes, it’s right that this slider behaves differently compared to others. But what bothers you so much about it?
The advantage I see with this concept is, that you immediately have a clear indication, how much space you have available towards full white (to the right) or full black (to the left). And yes, it’s somehow the visualization of the x-axis in the curve display. But in the curve display you can’t move the pivot point.
Assumed, the slider has its 0 position in the center, in return you would have different value ranges covered by the same slider-distances to both sides. Won’t this perhaps puzzle the user somehow more (I’m not sure, if there are already such sliders in other modules, haven’t done any “research” on that)?
3 Likes
Well, it is what it is, now.
My thoughts:
- ‘27% towards white’ means nothing to a photographer; x EV above mid-grey does.
- same change per unit mouse movement in + and - direction
The release is coming, and I’m tired. For now, there’s a crash to fix, and there is no time for feature changes, not until the the release is out. We can tweak the UI during the next release cycle, if people are dissatisfied.
6 Likes