That commented-out val = pow(val, vec3(2.2)) line would take the display-encoded value back into linear, but the shader does not need that (it goes directly to the display).
The ‘scale’ values are also a lot lower. From what I have seen, they are usually at most in the low 2 digits, usually – that 334 is already high. The original curve demo at desmos does not allow power < 1.
I left some versions out for testing but tried now the last version. I still think that AgX is the mightiest tonemapper. But anyway I think there is plenty of work to be done regarding UX.
Anyway I’m sure @kofa and the other developers will offer a brilliant tool when the time has come.
My thoughts regarding the ease of use:
I preferred the Offset slider with the whitepoint limit.
Black and whitepoint settings are working differently from what I would expect.
Maybe it would help the user if there would be a graph, showing the curve and how it is treated (like it is in filmic)
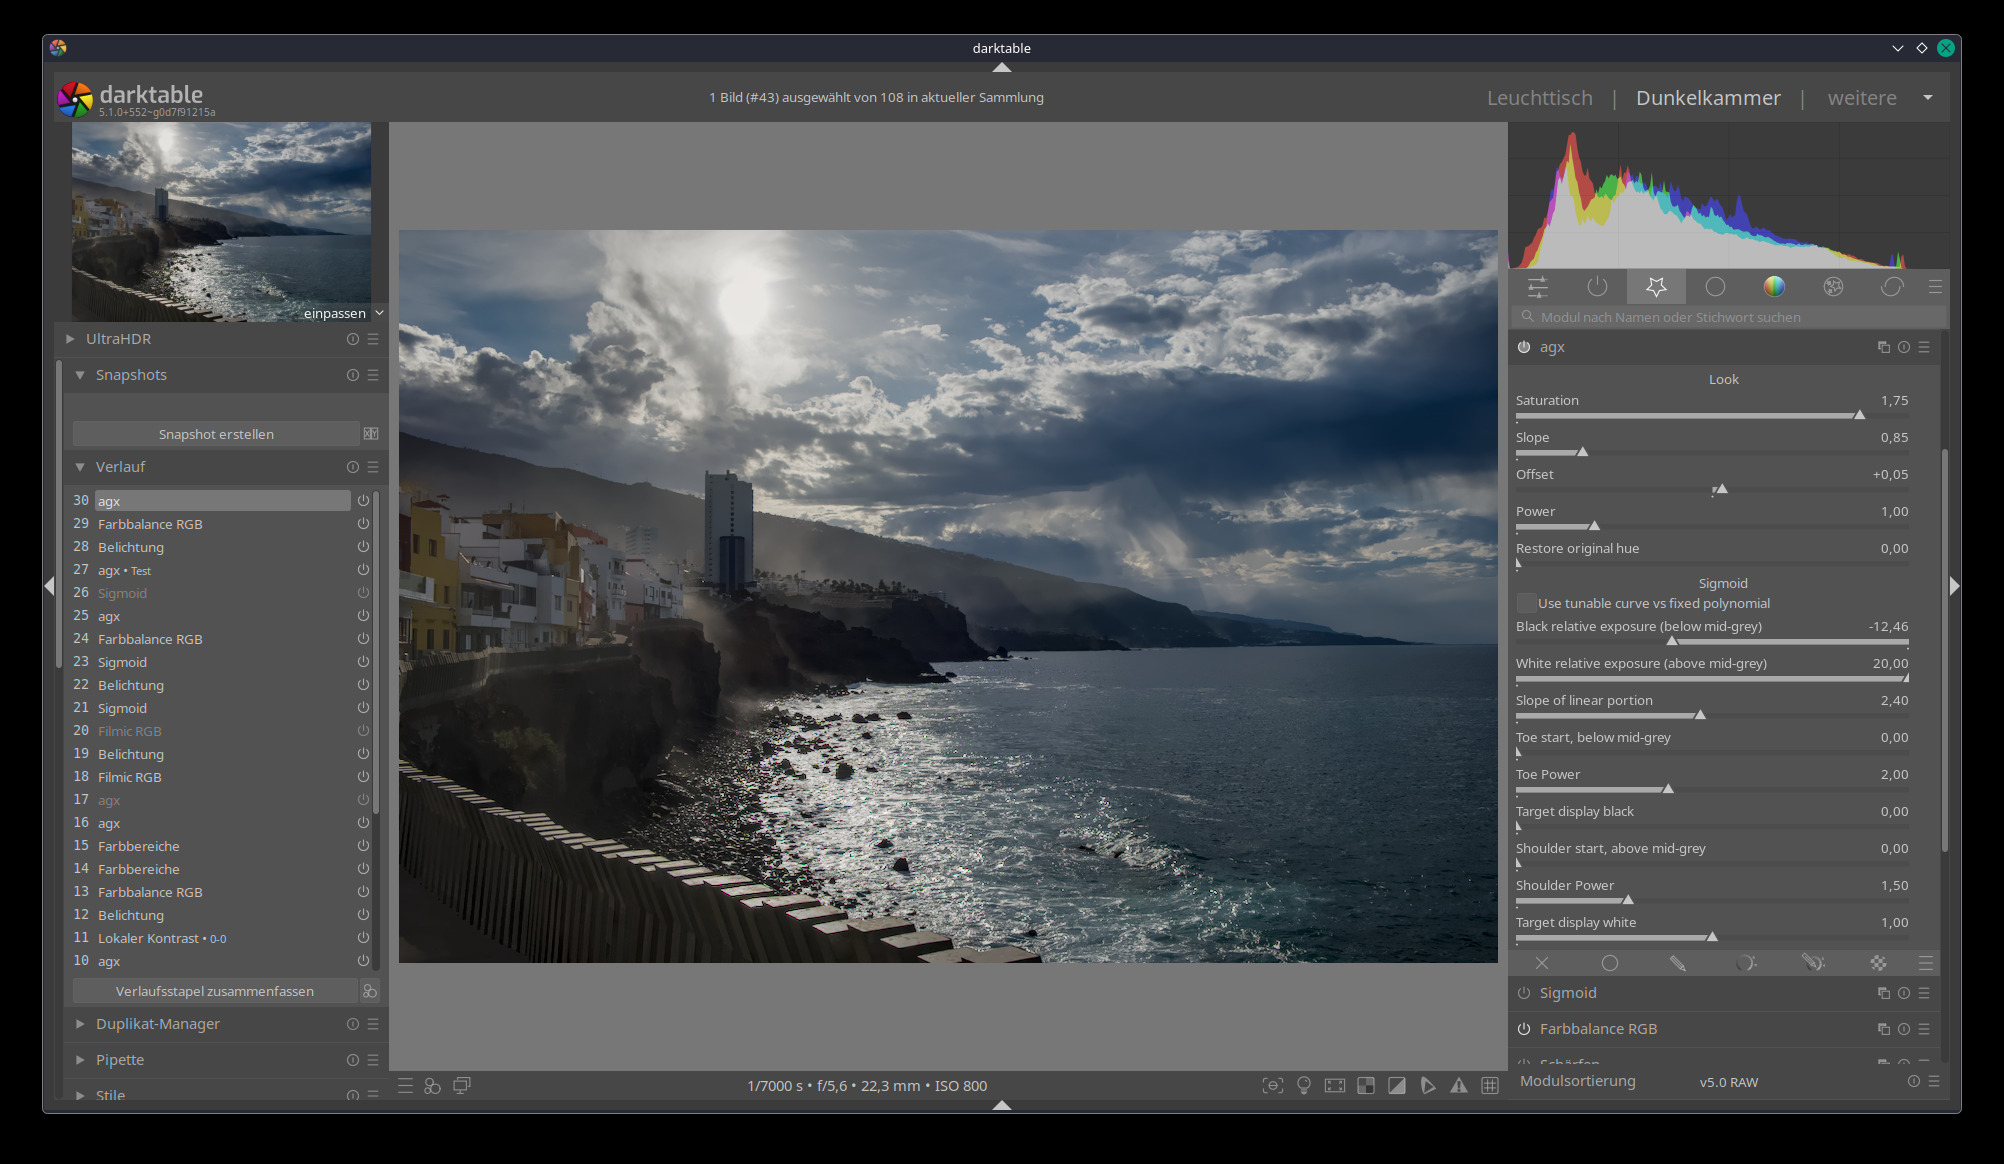
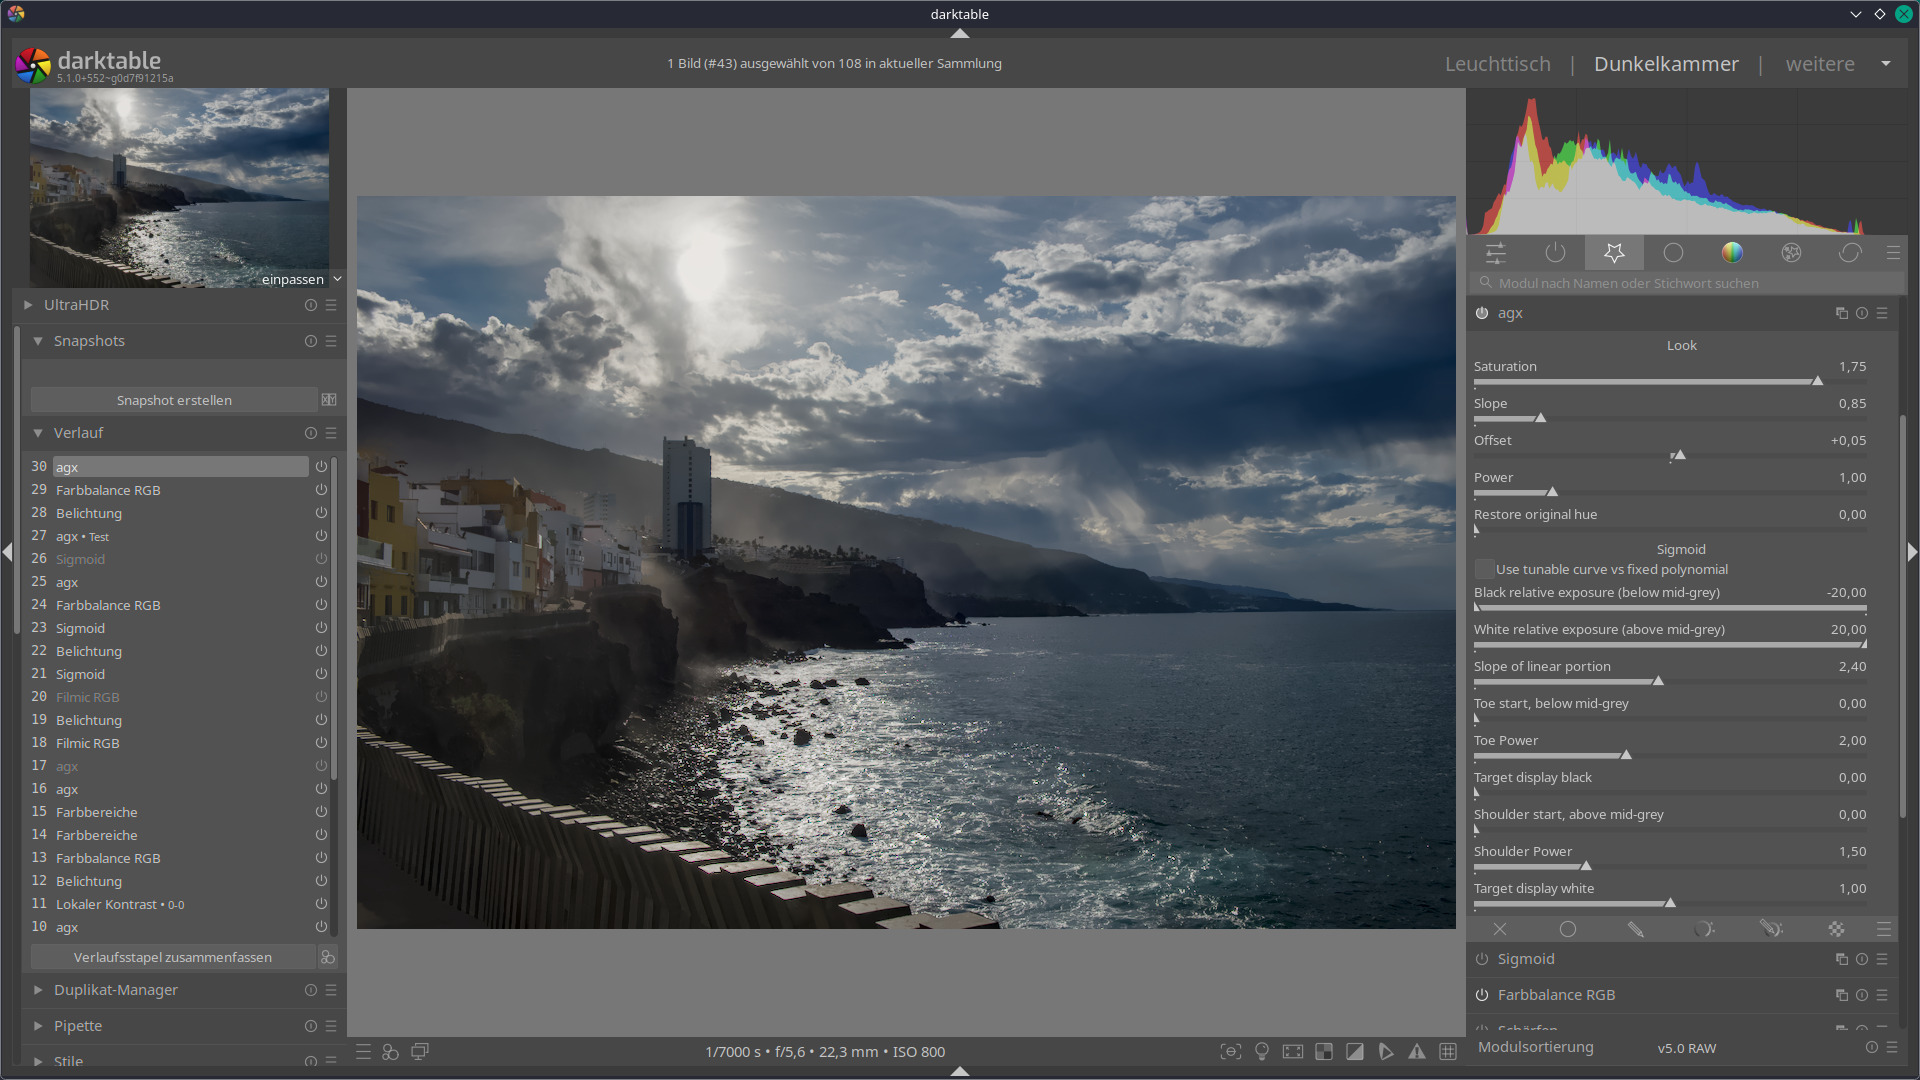
By the way a very good image for testing the abilities of the different tone mappers is this:
Do you mean the relative exposures (input black and white point), or the target black and white point?
Relative exposures, I think, behave in the same way as in filmic?
The output black/white are not well supported and need work (some of the code just uses 0 and 1, no matter what you set).
For me it is not logical, that the slider just has an effect until a specific position but when I move the slider further there is no visible change anymore . I don’t know if it works differently in filmic. I hardly use it.
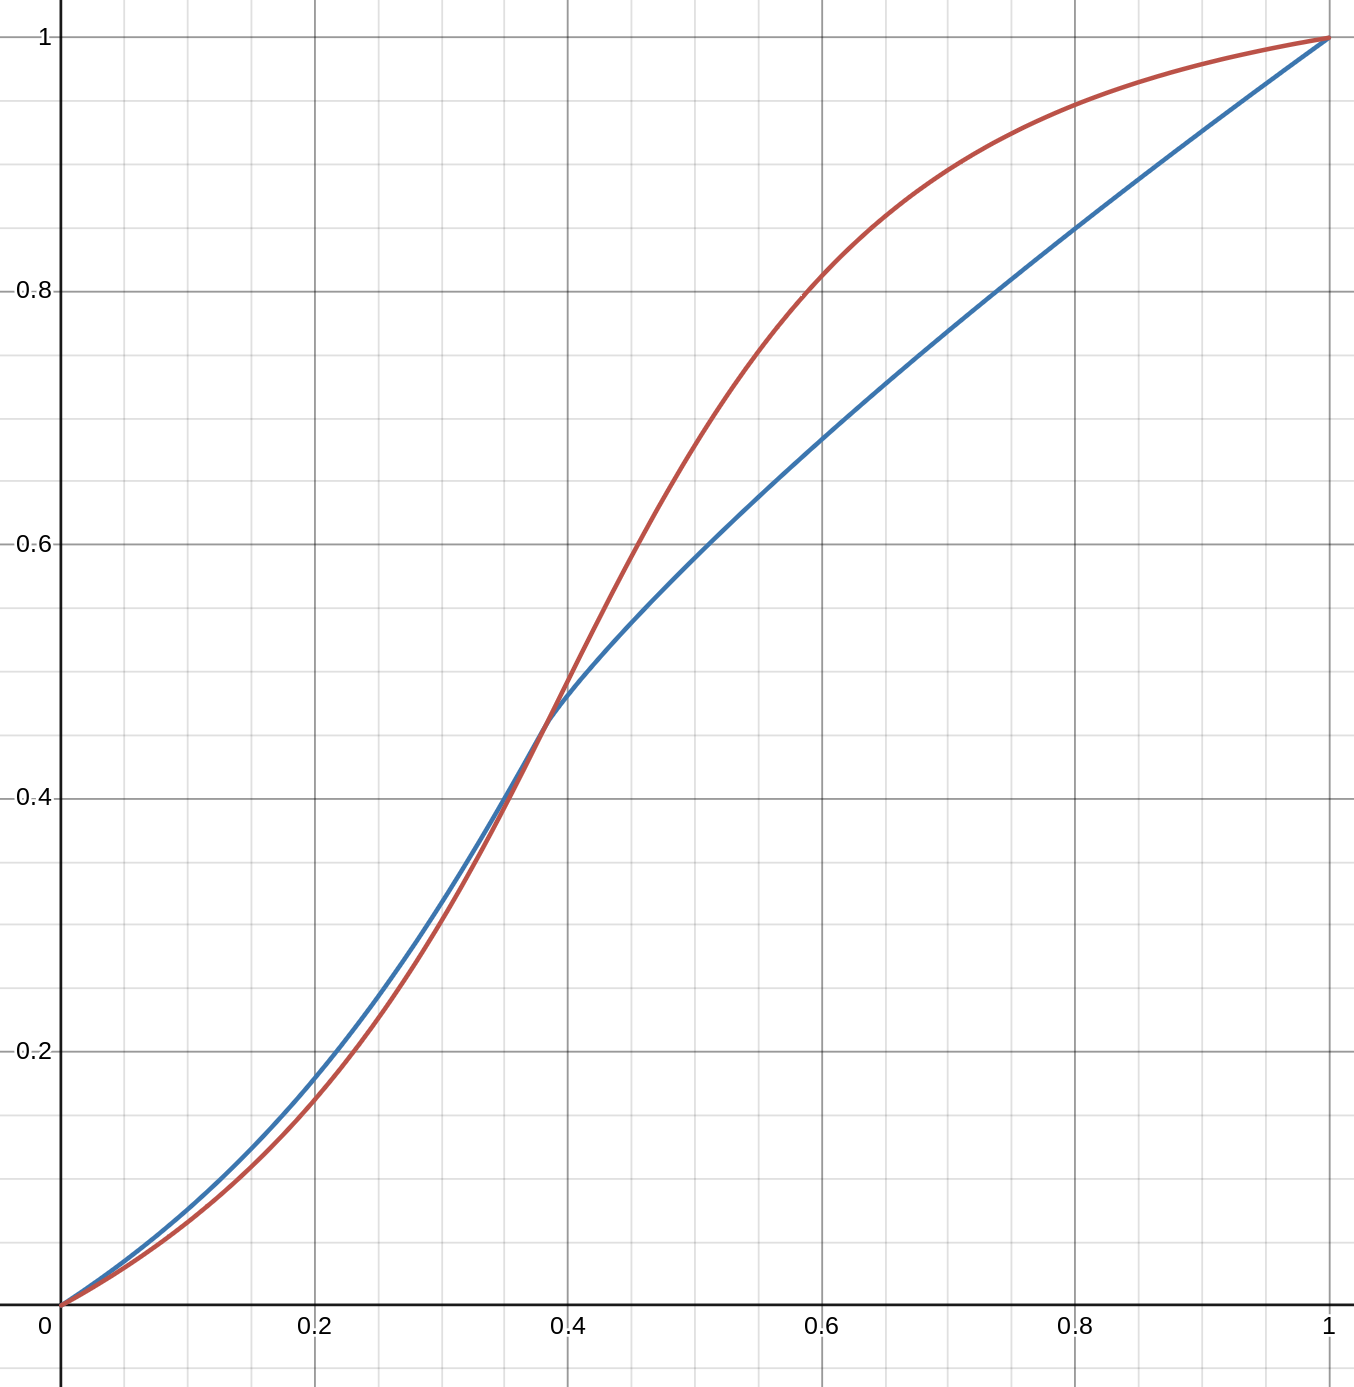
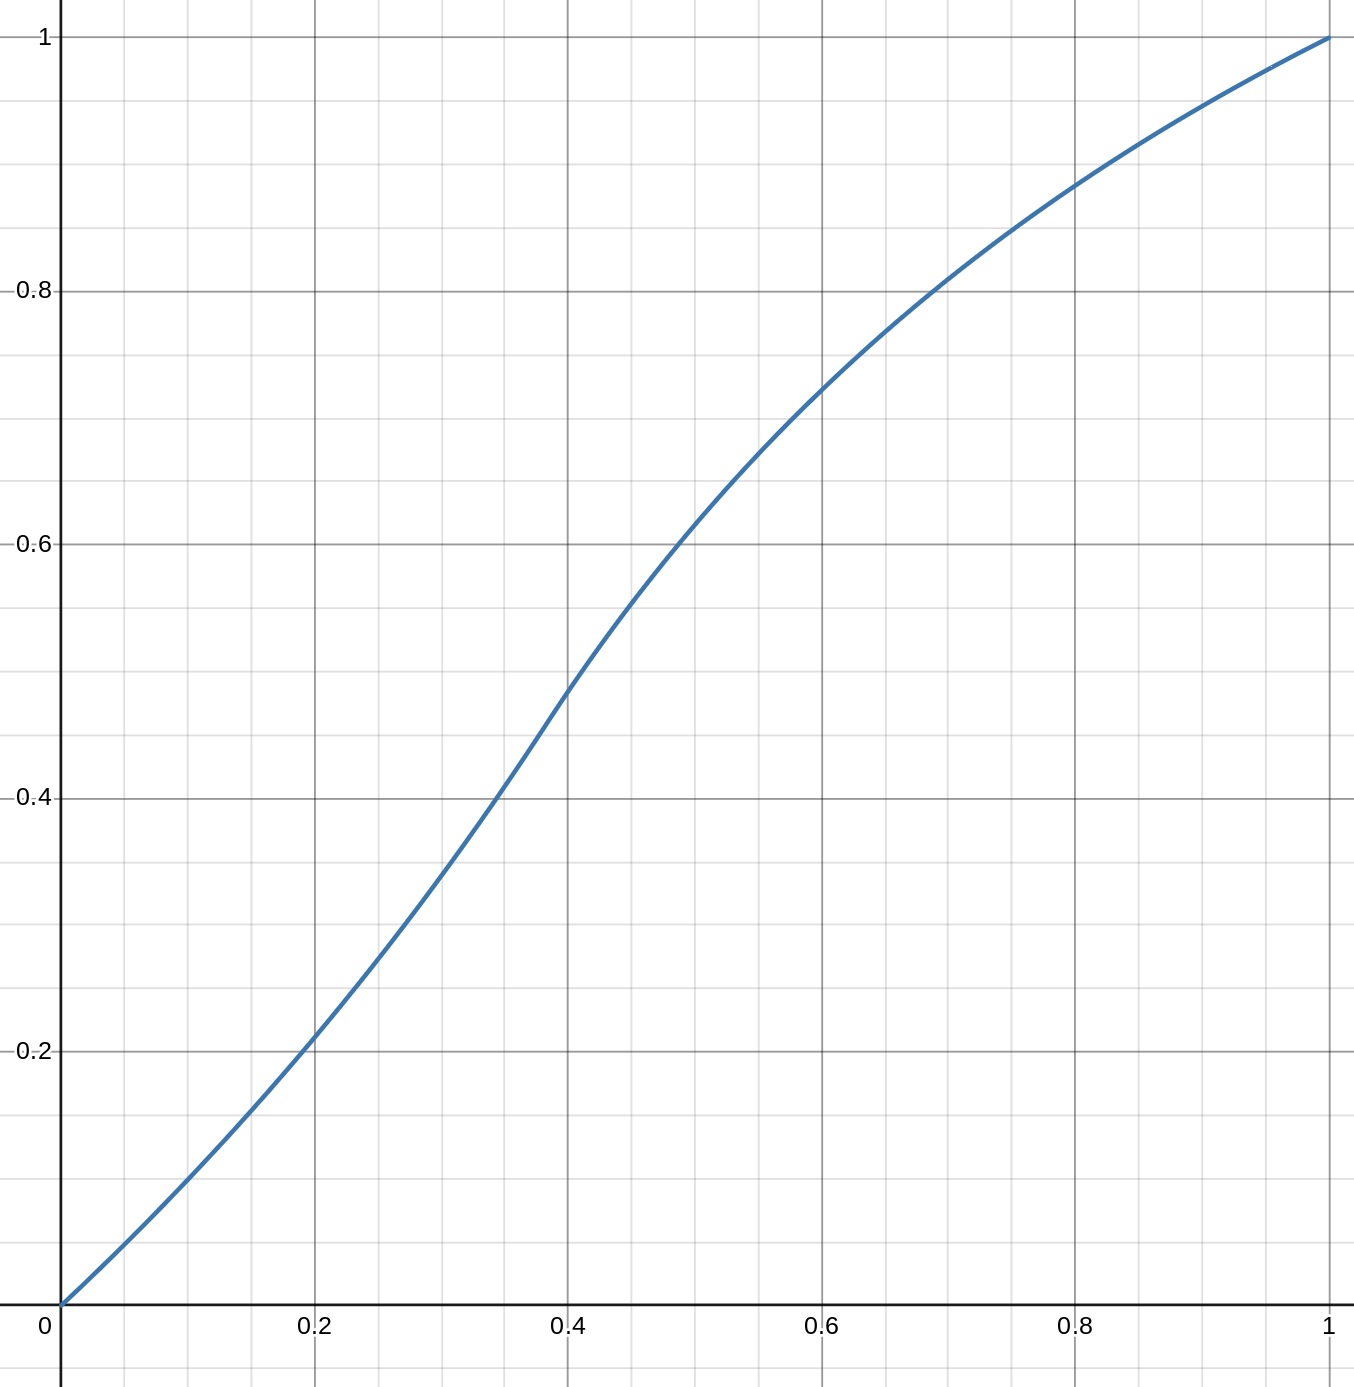
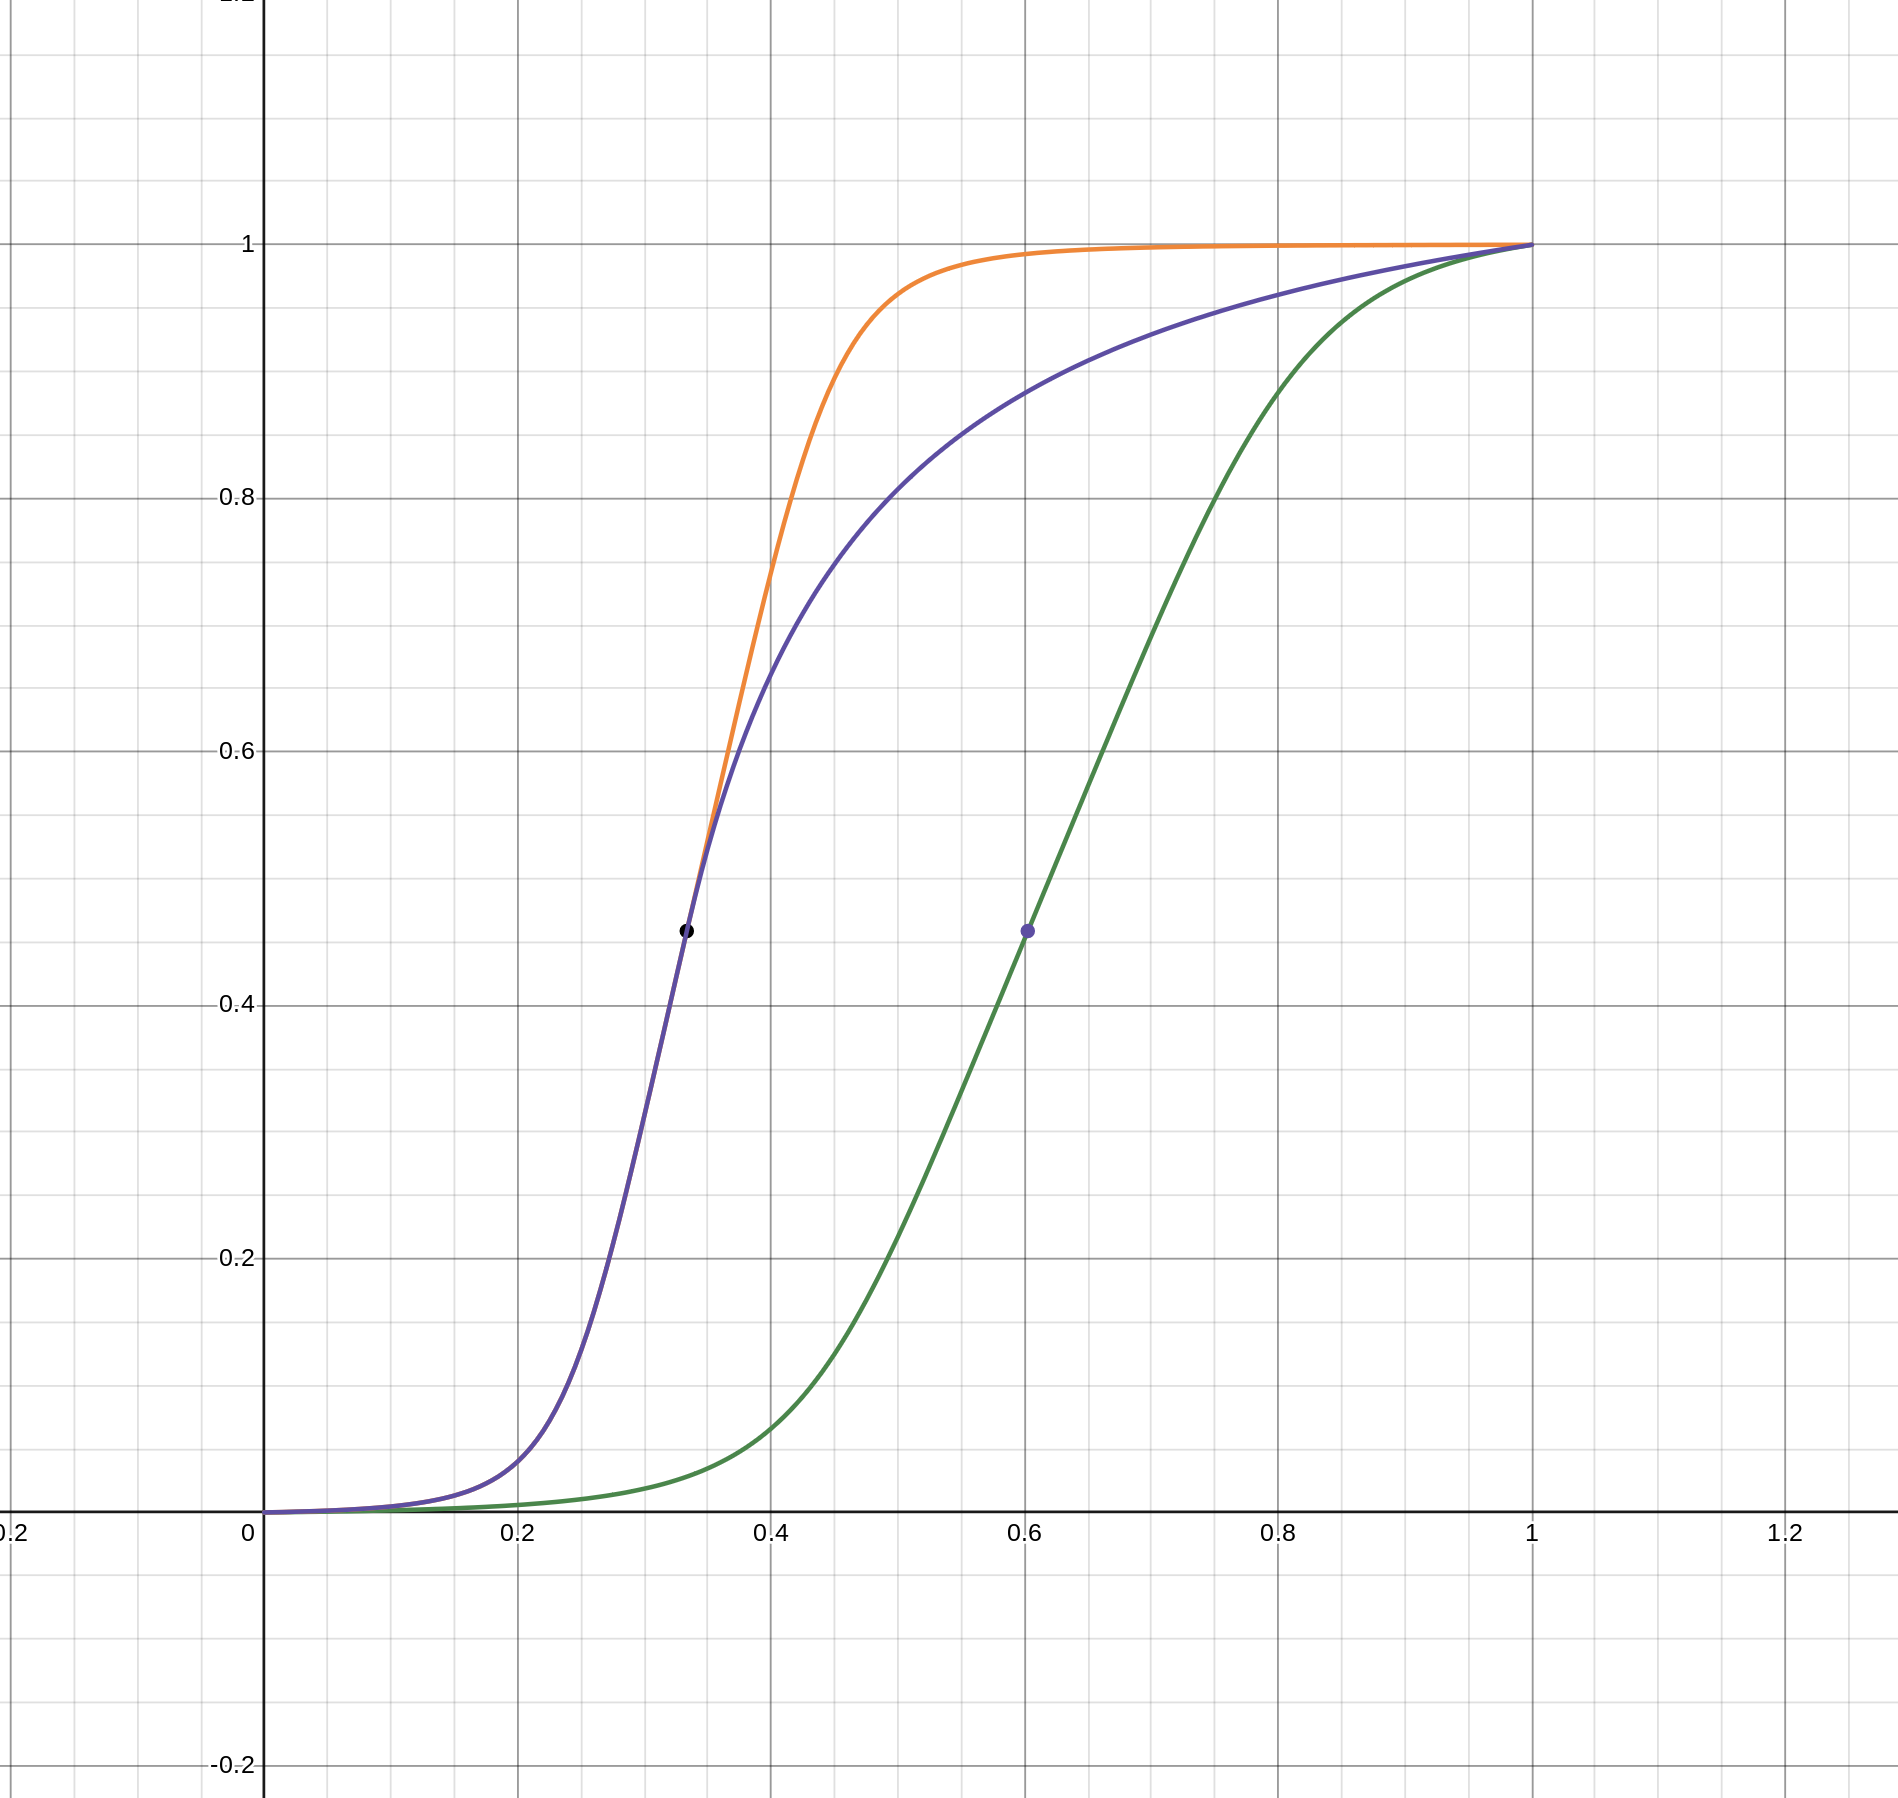
I see your point. I think that’s because of the shape of the curve. Here are the curves with black at -10 EV, white at 6.5 EV (green) and 20 EV; for 20 EV, the slope was the same high value as for 6.5 EV (orange), or it was dropped to 1 (purple):
They look quite different, but mid-grey (the dot) appears shifted much more to the left on the curve that runs to 20 EV. Suppose you have a pixel at 6 EV. That would be around the 0.97 mark for the green curve, mapped to almost 1. However, even though it is at around 0.53 for the orange curve, there is not so much difference at the Y output, it’s also very close to 1. Reducing the shoulder power extends the shoulder; that same 0.53 is mapped to about 0.8, if the power is set to 1.
Try this:
set the toe/shoulder power to 1
move the black and white exposure points
once you found the boundaries you want to keep, set the toe/shoulder power to taste.
Folks, with all this tuning, let’s not forget that AgX was developed to reflect certain properties of film. The original work is an opinionated mapper, one where certain values (relative exposures, toe and shoulder power, midtone contrast) were all pre-determined, and I assume the in/outset matrices were tuned to give pleasing colours using those values. Right now, the matrix is not tunable – I hope to get to it later. But it may be the case that for very different dynamic ranges and contrast settings, some other curve would be a better fit.
Hey there, I’ve been following this thread and I’m enjoying the work that is been done here. I want to implement it in darktable to test it but I have no idea how to do it, could someone please instruct me to try it out and thank you
Yes, that is the most important thing. Agx works very well together with color balance RGB. You can adapt Agx, as it is now, wonderfully well to the different scenes. In my experience so far, much better than other two tone mappers.
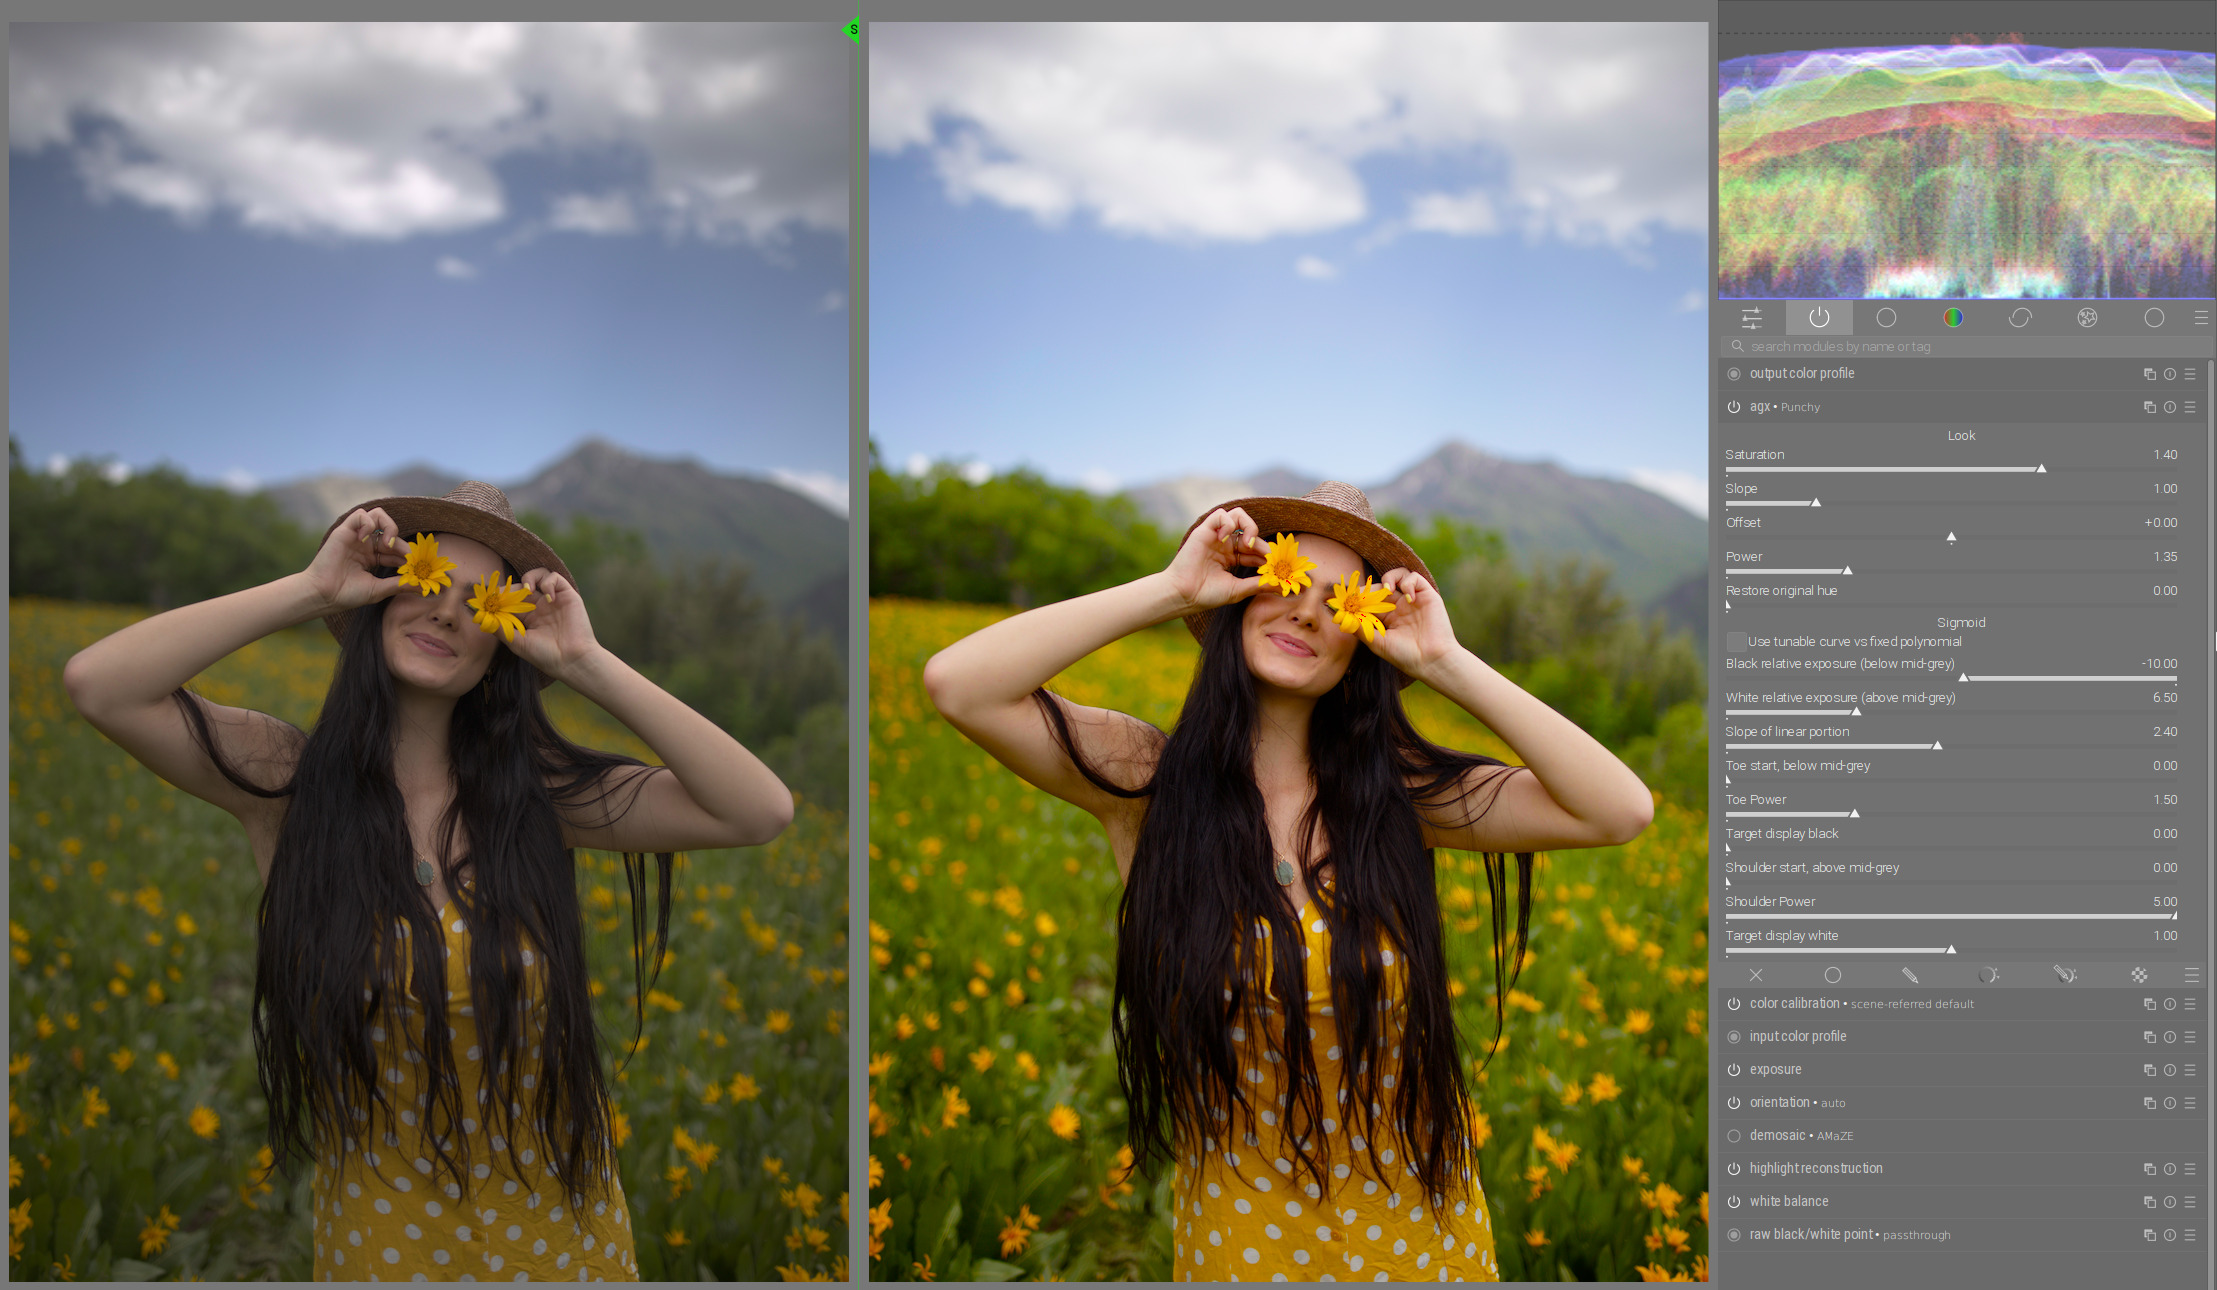
And I’ve also found that a very good starting point for most cases is “Punchy” preset with the sholder power set to 5:
That is so funny. I was having the same experience but wondered if it was just the sample of images that I had worked on. I have found right from the start even when there were just the 4 sliders I could get a very nice base image to tweak with RBG CB
You need to keep it separate…so at least what I did was install it in its own DIrectory…DT_AGX and I made a config folder in that directory.
THen you run DT with a modified shortcut using --configdir and point it there… also I turned off writing xmp just to be sure I didn’t screw up and finally I only edited test images with this version and I placed them all in a test folder…
As an experiment, I added a control that allows you to adjust the ‘internal gamma’ of the curve.
The module takes linear input, tweaks the matrix, and then performs a log before applying the sigmoid. The output of the sigmoid is actually ready for a display: not only is it between 0 and 1 (or the selected target points), but it also has a ‘gamma’ applied. This is, by default, 2.2. I’ve now exposed that as a control. After the sigmoid, the power is applied to ‘decode the gamma’, and the output is display-referred (0…1, or target bounds), but linearly encoded.
So, this value shifts the numerical value used to represent the output (y) of the pivot point (not its meaning, or brightness at the output, just its representation). This means the toe and the shoulder join the linear section (if there is none, the pivot) at a different y value. It behaves a bit like a contrast control. Maybe it can be used well with the toe/shoulder controls.
Anyway, experiment with it, and let me know if it’s useful (honestly, I did not find the effect mind-blowing, but I only tried it on one image). If it’s useless, we can quickly get rid of it.
Next up: target black/white, pivot x (sometime later this week, probably only during the weekend).