I have developed and published an RGB sigmoid curve script.
Purpose of this script
The main purpose of developing this script is to provide a tool for more efficient restoration and editing of faded film or photographic prints images.
In photographs with appropriate colors, especially landscapes, their R, G, and B histograms generally have a similar shape, although with some degree of deviation. In this case, if we take the correlation coefficients between the R, G, and B pixels, they are often greater than 0.90 with respect to each other. This means that the respective channel images of R, G, and B are very similar.

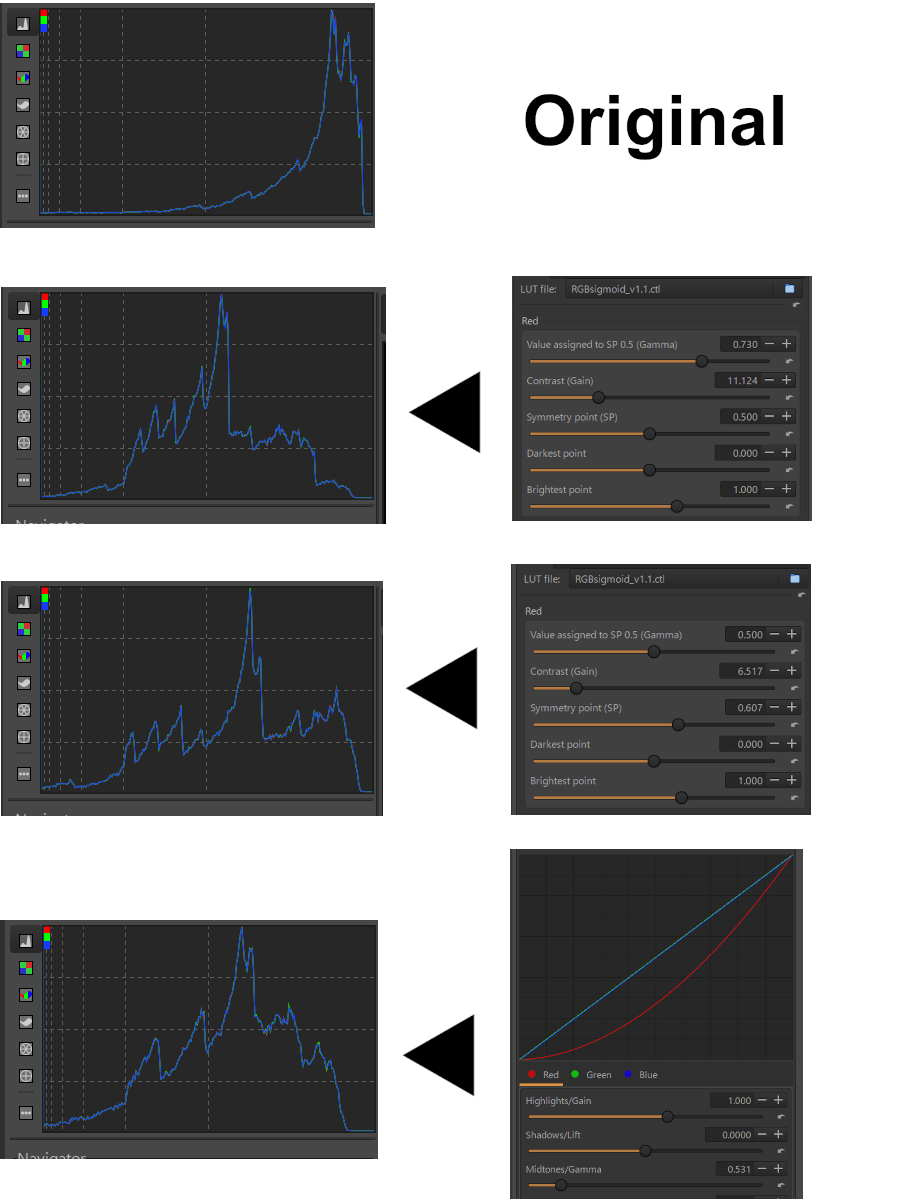
[Histogram example of normal image]
However, in faded and discolored photographs, the correlation coefficients between R, G, and B pixels are much lower than in normal images. The channel images are also not very similar compared to the normal images.

[Histogram example of discolored image]
Therefore, the first step in restoring a faded photo is to make the image and histogram of the R, G, and B channels similar to each other. This script was developed to facilitate this kind of editing.
The basic idea of this script
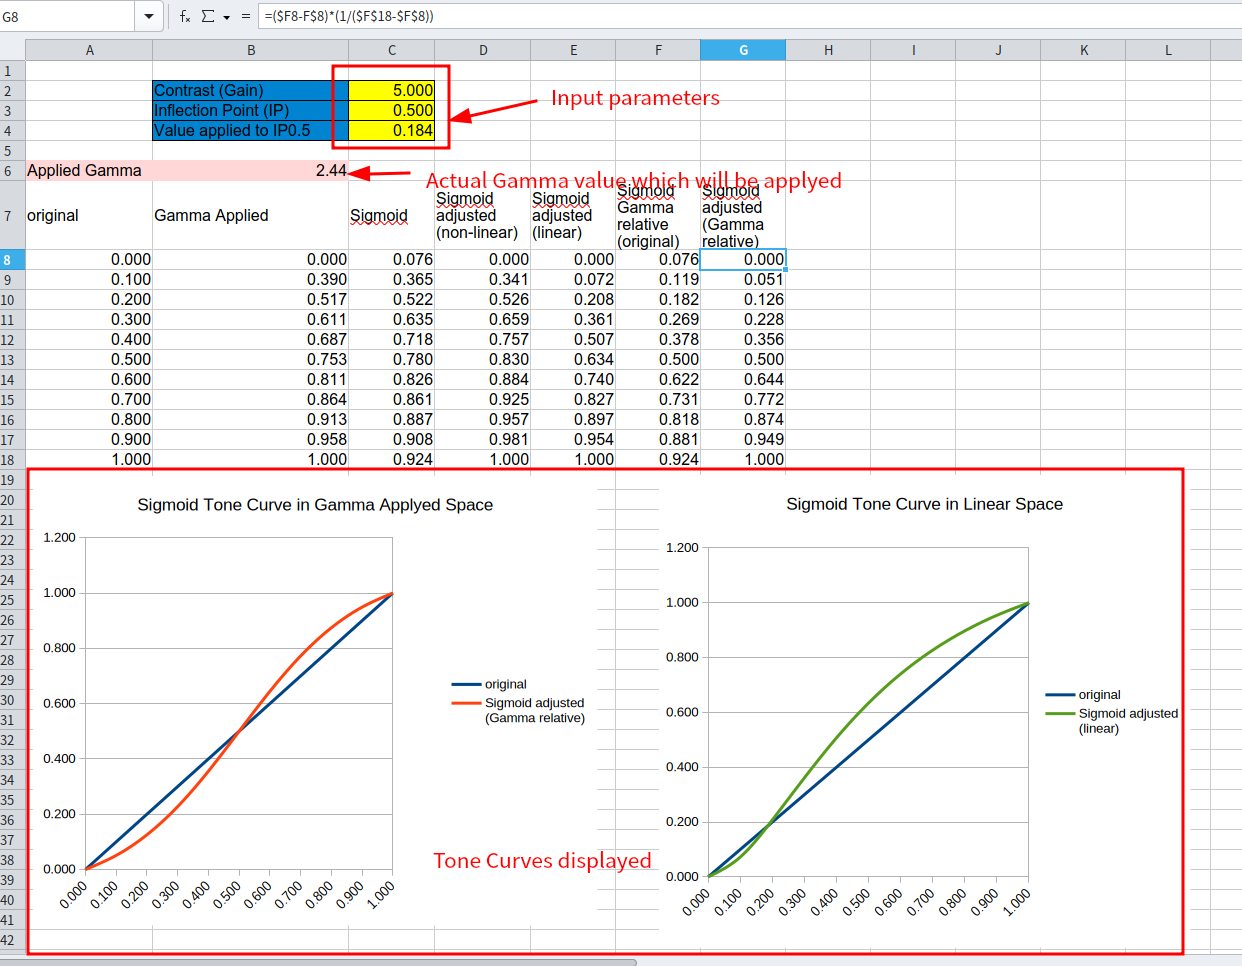
The goal of this script is to restore the pixel distribution of each channel, which has been corrupted by fading, to a state close to the original pixel distribution by adjusting the dynamic range and applying a tone curve with an adjustable slope. The sigmoid curve is used for this tone curve.

[Basic Idea]
This idea is a little similar with “Separate RGB channels” mode in Color/Tone correction of ART or Level adjustment in GIMP, however I use sigmoid instead of Gamma correction. Gamma correction curve has no “tipping point”, but sigmoid curve has it. I think this difference is difinitively important.
How to get this script
Please download it from the following link.
Please also download the language files for internationalisation from the following link. Please note that the language files are translated directly from DeepL or Google Translate, except for the languages I can understand, so I cannot guarantee their accuracy.
https://drive.google.com/drive/folders/1yLFFn9Yci6wbyArKboFmHH9vI7nfA__b?usp=drive_link
The dialogue of this script
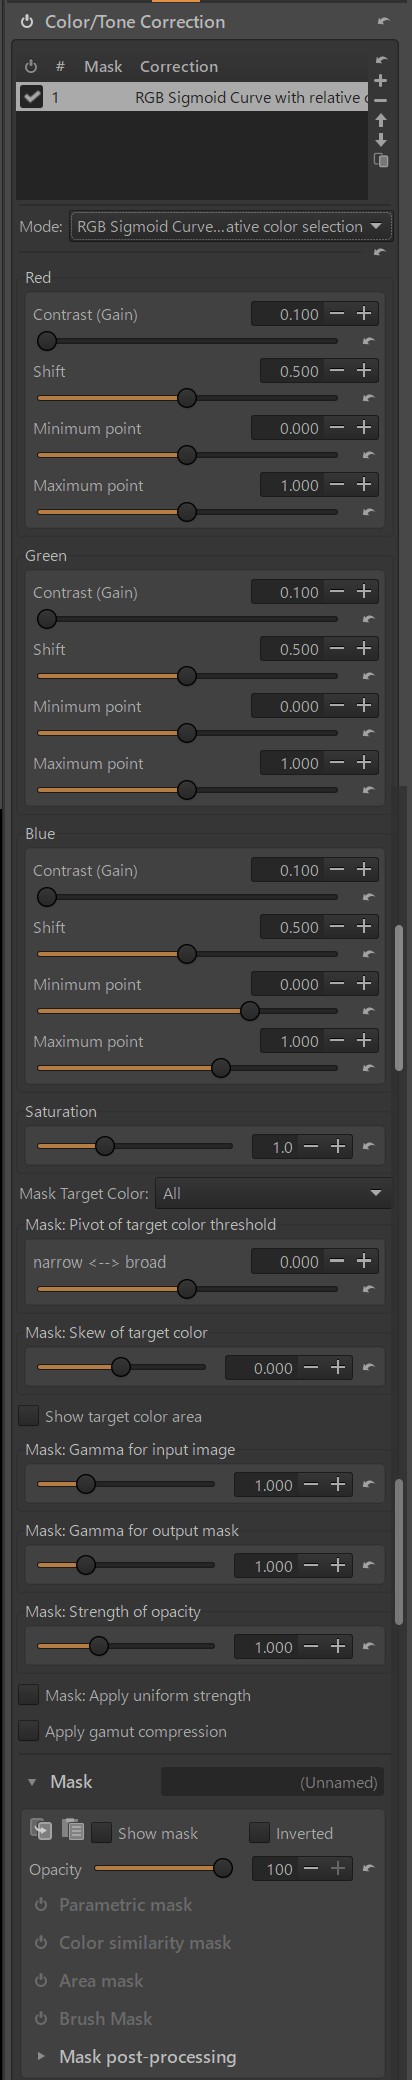
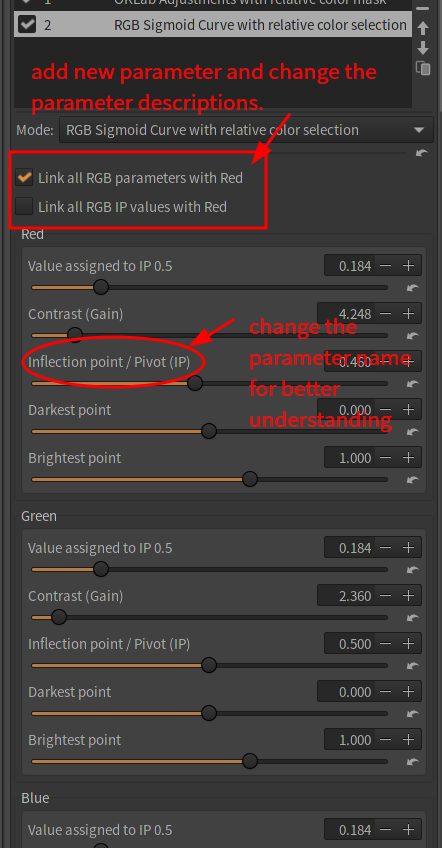
Parameters for each channel
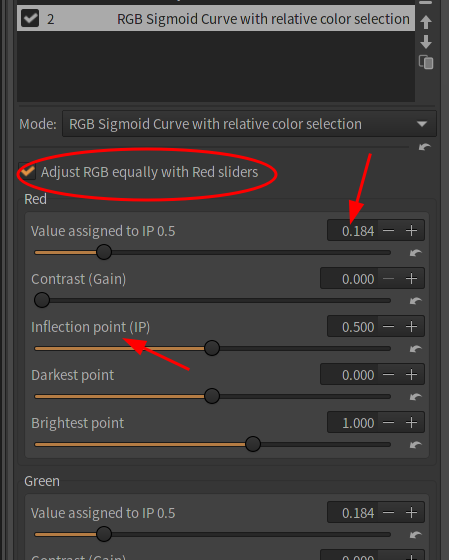
From the top of this dialog, for each of the R, G, and B channels, there are parameters that adjust the pixel distribution (histogram); they adjust contrast, shift, minimum point, and maximum point.
#Contrast
This parameter determines the slope of the sigmoidal tone curve shown above. The default value is 0.1, which is close to the straight line in the black diagonal in the figure above and changes the pixel values only slightly. Lower values are closer to a straight line (in which case the pixel change is negligible), while higher values result in a sharply sloping S-shaped curve (with a larger change).
#Shift
This parameter specifies the brightness point at which the sigmoid curve changes direction, the default value is 0.5 (perceptual mid gray point). Assuming a constant contrast (10.0), the curve would then look like following figure. If the original pixel value is greater than 0.5, the pixel value becomes brighter, while if it is less than 0.5, the pixel value becomes darker.

[Default: Shift = 0.5]
If this value is set to 0.2, the tipping point of original sigmoid value will be 0.2 and most of the curve will be upward. In the tapping point, the slope direction changes (less steep > steeper or steeper > less steep).

[Shift = 0.2]
Setting this value to 0.8 results in the following figure.
It darkens the image for most pixels.

[Shift = 0.8]
#Minimum and maximum points
These parameters specify the darkest and brightest points in the image. The default is 0.0 for the minimum point and 1.0 for the maximum point, and the original minimum and maximum values are not changed. If the minimum point is changed to a value higher than 0.0, its brightness becomes the new minimum value (0.0) and the overall image brightness is reduced. Conversely, changing to a negative value will do the opposite, brightening the image overall. If the maximum point is set to a value lower than 1.0, it becomes the new maximum value (1.0) and all pixels with a higher value are clipped to 1.0, resulting in an overall brightening. The opposite is true if the maximum value is set above 1.0.
For example, for the green channel in the histogram below, if the highest point in the green channel is lowered to 0.5, the entire pixel becomes brighter and the distribution changes to what is shown in the figure below.

[original]

[highlight clipped]
Minimum point is equivalent with Shadows/Lift in “Separate RGB channels” mode in Color/Tone correction, and Maximum point is equivalent with Highlight/Gain.
Relative Color Area Mask
Below the Saturation parameter, as in my other scripts, there is a Relative Color Area Mask to limit the effect to a specific color area. Default setting is not to apply any mask (applying editing effect to all color area).
For an explanation of the meaning of this parameter, see, for example, the following article.