@gadolf Not sure whether that would defeat the purpose of the module. However, it would be fun and interesting for the tinkerers like yourself.
Yes … unintuitive indeed.
So one should find the benefit using presets, or at least history copy/paste between images. To be explored ![]() .
.
By the time being color balance changes are slower to be displayed when filmic is on, but I cannot say that doesn’t work.
As I’m starting from images tweaked with unbreak, I’ve noticed that with filmic these images were more yellowish that with unbreak (same white balance and same exposure).
Does that seem normal ? Any tip to explore / understand / control this ?
@afre Not sure if I understood in what sense it would defeat that purpose, but what I was trying to ask is if there is a way to turn the S curve parameters section in the filmic module into graphic tweaks of the curve that is already there (and that currently changes according to parameters changes). In other words, to translate curve tweaks into changes of the same exact parameters of that section.
If you are asking to have a more graphical interface rather than just sliders, I concur. I have made that request myself wrt PhotoFlow on a dozen occasions.
1 Like
No. Indeed, it would defeat the purpose of having a parametric curve. It you want a manual control over the curve, put the contrast at 1 in filmic, and use a centered S-curve in tone curves in RGB color space.
Provided that the pixelpipe is Lab and both modules work in RGB, these 2 modules have 2 Lab ↔ RGB conversions to run. I would very much like to have a RGB pipe, but that won’t happen overnight.
All I can say is, if you use a custom ICC or LUT color profile, filmic will not forgive any inaccuracy of the profile and tends to amplify them. I don’t use LUTs myself for this reason: it’s very difficult to have a well lit chart to produce accurate profiles outside of a metrology lab. And, of course, forget about profiling with a color-checker.
@anon41087856: @gadolf is looking for a visual representation of what is going on with the sliders.
not sure I understand. The curve is the visual representation.
Sorry, I meant an s-curve that could be moved around but one that reflects the slider in question. Anyway, I will let him speak for himself. Just trying to be helpful. 
@anon41087856 @afre Let me be more specific.
In your latest tutorial on Github, you say:
The contrast is the slope of the linear middle part of the S
Question: If I steepen - or flatten - the linear middle part of the curve, couldn’t that change in the shape of the curve be translated into a value, as if I changed the contrast slider to that value?
The latitude is the length of that linear part
Question: If I increase - or decrease - the length of the middle part of the curve, couldn’t that change in the shape of the curve be translated into a value, as if I changed the latitude slider to that value?
The balance shadows/highlights will translate the linear part toward the highlights or the shadows so one extreme has more room than the other
Question: If I shift the the linear middle part of the curve, couldn’t that change in the shape of the curve be translated into a value, as if I changed the shadows/highlights slider to that value?
As for the saturation slider, I can’t imagine how it could be mapped to a graphical change in the shape of that curve, so it would probably be the only slider left.
Does this make any sense?
EDIT: And please, this is just an idea, don’t take it as a enfant gâté thing. The tool is fantastic as it is now.
My understanding (nil really) is that the curve can’t have the “freedom” of a normal tone curve and that it would be incredibly unintuitive to try to push it around like a normal curve. Nodes wouldn’t freely move but get stuck and move based on other nodes.
This is just me guessing by the way
Unbreak doesn’t behave as filmic. When we move the middle grey on unbreak we can get back the same histogram tweaking black point accordingly (grey *2 => black - 1).
In case of filmic, the same operation doesn’t produce the same effect.
Descreasing the grey point (and adapting white and black point accordingly, dynamic range staying constant) the center of histogram concentrates to the right, the image moving to high key. Increasing the grey point does exactly the opposite.
Then comes the suggestion. Instead of changing the 3 sliders in sequence every time it would be faster to have a mode keeping automatically black and white point synchronized with the grey point (grey *2 => white/black - 1). It would become faster (and more intuitive) to balance the histogram.
I think you are right. But a kind of middle way could be achieved if it were possible to:
- display the calculated control points on the curve
- and make them alterable by the user (the program would keep them in acceptable limits).
of course they don’t, filmic has a log + tonecurve to remap the log output grey to your display grey. Unbreak has only the log. And the grey slider you have is the log input grey.
yes, that’s a dynamic range compression.
noooooooo ![]()
the grey slider is not -black / dynamic range, which is the grey value at the output of the log. It is the scene-referred grey which acts as fulcrum and a pre-amplification before the log.
Your scene-referred grey is the luminance of the grey patch of your color-chart, usually 18%. So we divide the input by this value to remap the input grey to 1. log(x) has a stiff slope for x < 1 and a flatter part for x > 1, so the shadows < 18 % get lifted more than the mid-tones and highlights.
Then, you normalize the log output to [0; 1] subtracting by the black level and dividing by the dynamic range. But now, your new grey value is between 50 and 75 (XYZ luminance) which would be ok if your screen was logarithmic, but is not since it is gamma-corrected and expect a grey point at 18 .
So we tune a tone-curve to drop the luminance of the grey to (output grey log / grey display)^(1/gamma), and then, add some more contrast. The last step is to apply a reverse-gamma correction y = x^gamma so that the log + contrast is linearized for the stupid screen/ICC gamma.
Which values ? You already have values in contrast, latitude, etc. and their graphical effect, you want me to translate that in another metric ? Which one ? I’m lost here.
See below e.g. When I move the slider, the curve changes accordingly. I think what @gadolf would like is a tiny curve for him to move back and forth using the mouse, to which the slider would follow. It is a novelty really and, in the view of non-visual types, unnecessary.

1 Like
So that’s already what happens in the module. The curve follows the parameters.
 We’ve been there before. I am thinking he wants something for the s-curve specifically. The curve provided is the sum of all the sliders’ settings, am I correct to say so? And could we move the curve around and have the sliders move automagically? I don’t know; I haven’t used the module myself.
PS @gadolf’s request isn’t that unusual. There are modules in dt that are visual rather than just sliders. In my opinion, the filmic module’s sliders are sufficient.
the problem is we are building a transfert function from an interpolation of nodes, not from an analytical expression.
It could be possible to allow nodes → parameters edition, but that would mean solving the equations the other way around with different constrains on each node and ensure consistency between parameters <-> nodes. With Python and a scientific package, that would be immediate, but that’s a hell of a job in C.
In darktable, there is no module that is visual + parametric in the same time.
2 Likes
Very true. That rounds the discussion nicely. Thanks for your patience.
1 Like
It’s Christmas every year, and so are darktable releases. Make sure to keep something for next year ![]() .
.
Please don’t cry, I don’t think I’m saying anything different. Obviously you tell it far better than I do ![]() .
.
Here with some screenshots to illustrate what I meant (and I think what your maths explain). I use 3 grey values 4, 8 and 16% and adjust with color picker the black and white points:

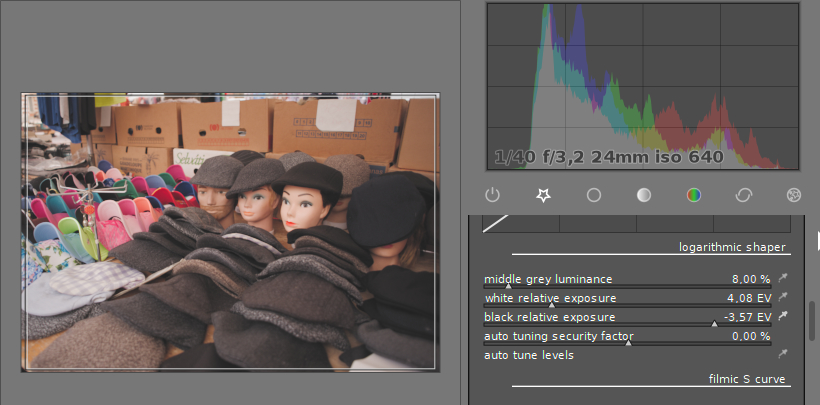

We can see:
- dymanic range remains constant (7,65EV)
- grey multiplied by 2 => black & white decreased by 1
- histogram moves from one side to the other
Excellent !
But to do so, each time I change the grey I’ve to reajust the black and white.
So my suggestion is, once the module knows the black and white point in function of a grey value, a special mode (lock ?) could control the black and white point when one changes the grey value.
When the grey value is not known, or for any esthetic reasons, I think that would fasten the quest of the right grey value (EDIT: especially when black or white cannot be caught by the color picker !).
1 Like