Shouldn’t have been more greens then, or maybe only grays?
No, the fact that bayer sensor has 2 x green (compared to red/blue) and that xtrans sensor has 2.5 x green (compared to red/blue) is taken into account already
Good to know that the raw histogram refers to the pre-demosaicing status and nonetheless it shows R-G-B channels. At least for me this makes the raw histogram confusing at best, and to make things even worse I think there is a problem with the horizontal scale (exposure stop) which is related only to the output rgb.
Please elaborate more.
Why shouldn’t it show RGB? The cfa has filters for R, G and B. Why should we only show grey in the histogram?
The horizontal axis of the raw histogram is perfectly linear regarding raw values if you use the linear or log-linear mode

No they are not the same if you use a linear EV scale on the x-axis and you position the EV0 mark correctly. But of course it all depends on what kind of information you need/want to extract from a raw file.
RawTherapee is almost there, and this is a great thing really.
Ah, I’d be interested in hearing (reading?) your expectations. To me, bear-of-little-brain, a histogram is pretty simple if you know the nature of the data from which it’s produced; the linear/linear-log/log-log/linear-whatever/whatever scaling is just depiction shenanigans. So, understanding what others’ expect “schools” me.
I’m also considering taking on a histogram programming challenge I received from @Elle Stone some months ago. That was directed toward a stand-alone freeware program that has since stagnated, but I’m still just noodling with the idea and where it manifests itself.
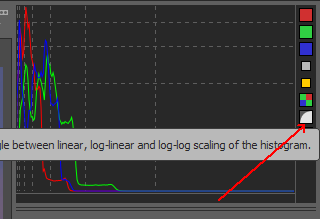
A wish list for a raw histogram: (exposure, sweet exposure) ![]()
- X-axis = linear exposure values (EV) (e.g. -5, -4, -3, -2, -1, 0, +1, +2, +3, +4, +5)
- set the EV0 value by clicking on a point (a grey card?) in the preview window
- leave some breathing room to both left and right to better view clipped shadows/highlights
- move over the preview to show the correspondent x-axis value, to evaluate the relation between the image object/subject and its exposure
- keep in mind we are talking about raw, so any preview should be blocked to a ‘neutral’ working profile just for mouse positioning and image parts recognition
- keep in mind we are talking about raw, so any exposure value (x-axis) should come directly from the a/d converter for each photosite (e.g. 0-4096)
This should be a good starting point for a deliberate and informed post-production.
2 Likes
Looks like a raw examination tool, something you would find when stacking multiple frames. Unsure whether this would be suitable for RT’s histogram…
1 Like
Well-described, thanks. My musings to date have focused on #3, but I’ve gradually come to realize the key relationship to consider within the “data pile” is EV. #6 is challenging, because for 14-bit raws the histogram buckets would be 0-16383. That’s a lot of buckets, and I’ve had to do “stupid pet tricks” to make such a histogram navigable without stuttering and blocking. Thinking about how I’ve had to recently consider my exposures, #2 in some form is going to be my new muse…
I’m struggling with #5. Typically when I consider a histogram, I want it to be collected from the working image, the one upon which I’m going to apply the next edit. That’s not necessarily what I’m seeing, as that has been pumped through the display profile. Although, there are times I want to see the result, so the output/display histogram is pertinent to an upstream edit. I’m also thinking this in terms of my software, which is not RawTherapee; I have a lot of (maybe, too much) discretion in where I work and view.
What is your software?
rawproc. It’s hack software I wrote. It’s like G’MIC with a GUI, you can open the raw file as RAW, then apply the operators to process it in any order you desire. I don’t recommend it. 
No one is perfect ![]()
I think of histograms as photographic tools, so that a ‘1/3 stop’ resolution would be enough. Speaking of raw histograms a 14-bit 24MP sensor would then generate 24 million values (no colors yet) in the range -10 : +10 stops in 1/3 stop so we have around 60 possible values for each pixel (not really a pixel yet).
That’s correct. But I think we should differentiate between the exposure and post-production, they are very different things: the former relates to lighting, shutter speeds, lens apertures and iso values, while the latter is just a mathematical trick, powerful as is but just a mathematical trick.
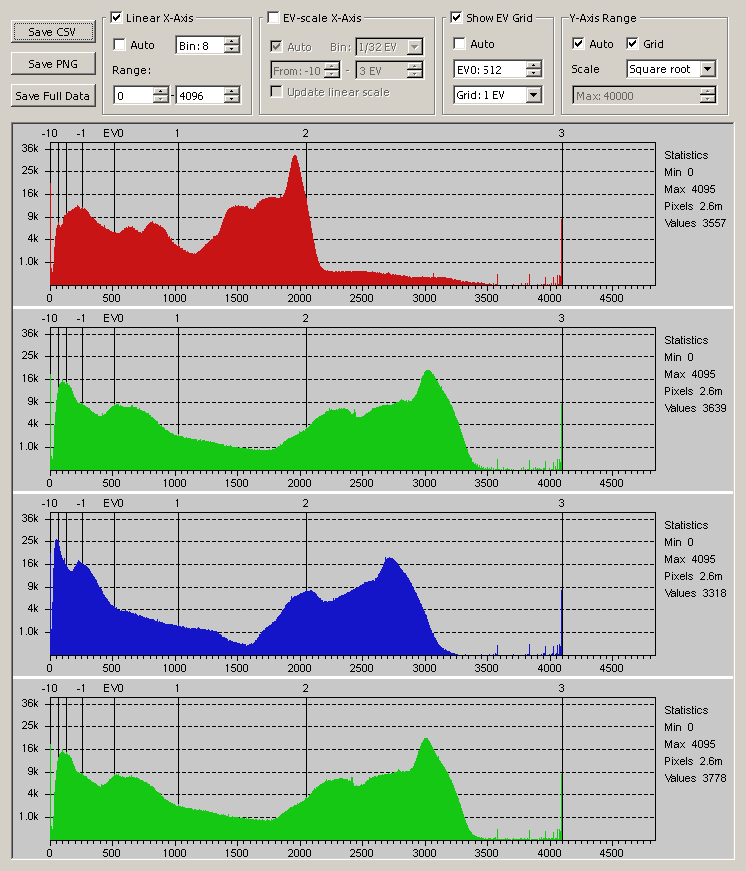
So here are the settings to get the closest match between raw and output histograms:
- reset to ‘neutral’ working profile;
- disable white balance;
- select ‘no profile’ as input profile;
- select sRGB as working profile;
- select sRGB as output profile;
- tone response curve = custom, gamma = 1
For some obscure reason (at least for me) selecting sRGB at points 4 and 5 leads to a closest match than ProPhoto.
Also, even if the raw histogram refers to RGB data before demosaicing and the output histogram refers to data after demosaicing, results are almost identical.
As you can see, losing our time on useless questions does not make us any better. (But maybe just happier  )
)
Did you know that you could create your own profiles in RT? You could have lots of fun experimenting with that tool.
Ooh! my own profiles… it’s certainly good but I know there are a lot of other useless thing that I could do first, it’s really a tough choice 
Getting attention for useful things would be a better choice imho…