Same here, the clamp function ensures the input are in ] 2^-dynamic range; inf [ so the log doesn’t output -inf
That is okay, I have been burnt out lately. Your feedback has been good. What I would say is that the module still isn’t straightforward to use. An outsider wouldn’t know what to do with it.
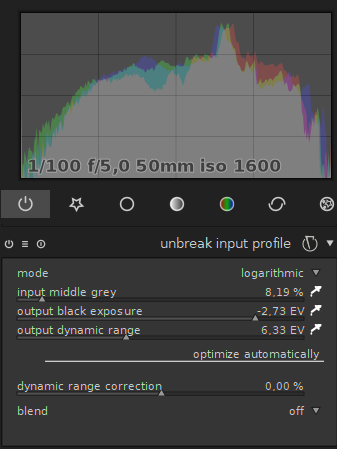
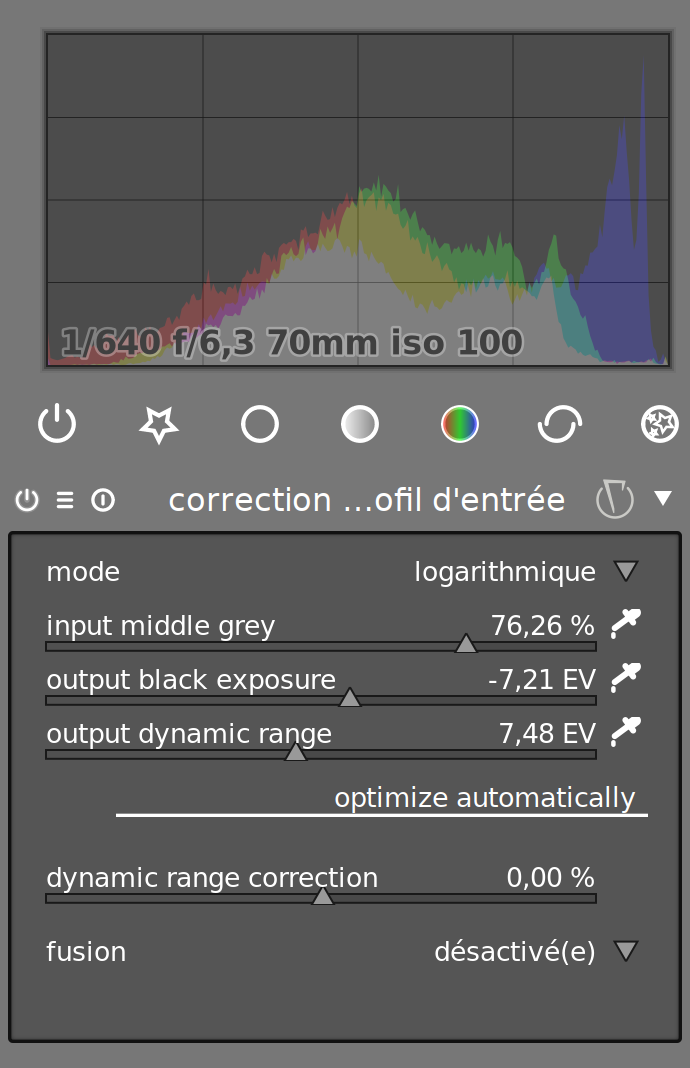
So the output data are controlled. This is what I can see on my image 1. just above. Without an other plugin after unbreak input profile the image is what I expect, even if I clip dark values.
The surprise is to see that the following plugin contrast brightness saturation explodes the noise while it should do nothing (all sliders to 0).
I’m a bit afraid to be stupid but let’s take the risk. This should be equal to:
log2(coeff)+log2(max_input)-log2(grey_level) -log2(coeff)-log2(min_input)+log2(grey_level)
= log2(max_input) - log2(min_input)
meaning that dynamic range is independent of grey level, which makes sense to me.
If I’m not mistaken the ouput ( [0,1] or ]0,1[, I don’t know) would be:
(log2(input) - log2(min_input)) / (log2(max_input) - log2(min_input))
= (log2(input) - log2(min_input)) / Dynamic range
What I understand here is that middle_grey is not necessary.
If I’m not yet completely lost, two settings should be enough then:
- black exposure
- dynamic range or white exposure.
Wrong or right on the above, I like the results I get with this plugin.
I find very intuitive to work with black exposure and dynamic range (or white exposure).
Usually color picker on black exposure and dynamic range make a good job.
When they don’t, working jointly with indicator over/under exposed and histogram, it’s very easy to tune these settings.
I like also the smooth grading of output tones, easier to achieve than with base curve plugin.
The grey level acts as an exposure gain on the input. The lowest the grey value is, the highest the signal (input) gets amplified before the log, the less the noise gets pushed into the -inf pit.
Your maths are correct, but they only apply if you want your output to preserve 100 % of the dynamic range. In real world, you want to sacrifice the noisy pixels to preserve the mid-tones. That’s why the dynamic range + black exposure are not dependant of the grey level in the UI.
The main problem is you don’t know beforehand what is the highest value of the noise (or the lowest value of true black), so no algorithm can compute the bottom part of the dynamic range (except if you are the sensor manufacturer, and even then…). It has to be adjusted visually by the user.
You might want to consider a parametric contrast curve to stack after the base log. Coupled with a fulcrum based CDL, you’d have a full set of tools for grading an image without many of the silly bits in DT.
To do a parametric contrast curve, the math should be pretty easy to sort out. It’s simply a sigmoidal curve, ideally with a linear section in the middle.
The parameters would be linear slope dynamic range, slope, and fulcrum point corresponding to the stops in your log2 encoding. In an ideal world, the slope is nonzero at the extremes, with a tension control to quantise lower and upper code values to integer bit depth encoding lowest / highest value (EG: At 8 bits per channel, 0.00392156862 and 0.99607843137 respectively).
If the maths are correct, middle grey has disappeared. If I want to sacrifice the noisy pixel I’ve just to push the black exposure slider to right.
In fact, choosing where I set the black point and the white point, I can include or eliminate the edges. Exactly the same as with the levels plugin.
The difference is that the log2 imposes the slope while the levels plugin lets chose the middle point (and change the slope).
I don’t know if that would work but we could achieve a similar effect modifying the base of the log.

But as @anon11264400 says that may be silly bits …
EDIT : Not a good idea. @anon11264400 would be right.
As logb(x) = ln(x)/ln(b), modifying the base of the log would not change the output. Sorry.
For now, I have implemented the full CDL stack (saturation, slope/offset/power, fulcrum contrast), and it gives very good results.
I think the parametric contrast curve is easily achieved in the regular tone-curve module. That’s what I do for now anyway.
Yeah log(a) / log(b) ≠ log(a / b). The base of the log is not the slope. The grey level sets how you balance the part of the dynamic range you allocate to the shadows and the part of you allocate to the highlights. If you set the grey to the average luminance of the picture, you recenter the histogram on 50 %, which gives you a safe distribution before ICC color correction. Remember that color calibrations (semi-reflective) charts have roughly 2.5 EV of dynamic range, from L = 17-18 (black) to L = 96 (black). Between 0 - 18 and above 96, the correction is extrapolated, so the ICC profile produces garbage.
Having the 3 parameters (dynamic range, black EV, grey level) is usefull when you are in studio, you can measure the scene lighting dynamic range with a posemeter, and shoot a grey target. So there is no guessing, you input the 3 numbers and you get spot-on exposure.
Absolutely. Chuck a fulcrum in there for a particular value, and you have some terrific control.
Indeed. As long as it comes after the log transform. The only slippery part is remapping the log’s middle grey code value to the aesthetic transfer function’s code value appropriate for the display in question.
Well, that’s doable with eye appreciation on a calibrated screen, isn’t it ? At that point in the process, you might want to get some creative control over the picture, otherwise it’s just technical processing.
That sounds great but you have said earlier this plugin is not linked to real word coming after exposure, … then I don’t succeed in understanding what is really done.
The calculated output is:
= (log2(input)-log2(min_input)) / (log2(min_input)-log2(min_input))
Where coef and grey_level have no influence.
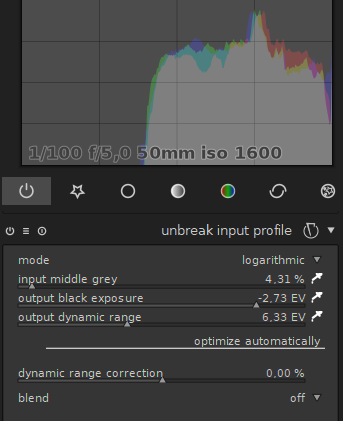
But when I move the grey point the histogram shows that I actually change the dark point (and dynamic range) which is counter intuitive. See:
You offer 3 settings, but there are only 2 independent variables.
Your maths must be a bit different from the one above.
Moving the grey independently should move left or right the middle pic without moving the borders.
It is necessary to be able to set the grey point, I agree totally, independently of black and white point.
The middle grey slider doesn’t do it as expected.
Your CDL stack should be the right place (slope/offset/power), shouldn’t it ?
Absolutely. It is just a matter of having a reasonable entry point. Given the normalized log ends up with a middle grey point at an arbitrary position depending on the dynamic range in question, this can be a little tricky to map for starting out.
No, what I said (or meant, I don’t remember what I said) is it not linked to the theoric dynamic range of the sensor (its bit-depth). But it is linked to the actual scene lighting, given you didn’t adjust the exposure earlier in the pixelpipe, before this module.
Ok, after moving the grey value, try moving the black point accordingly, and then the dynamic range. Your histogram should have a different shape. It’s not just a matter of limits. What the grey point does is allowing you to shape the distribution of luminances. What you look at are only the limits of the histogram.
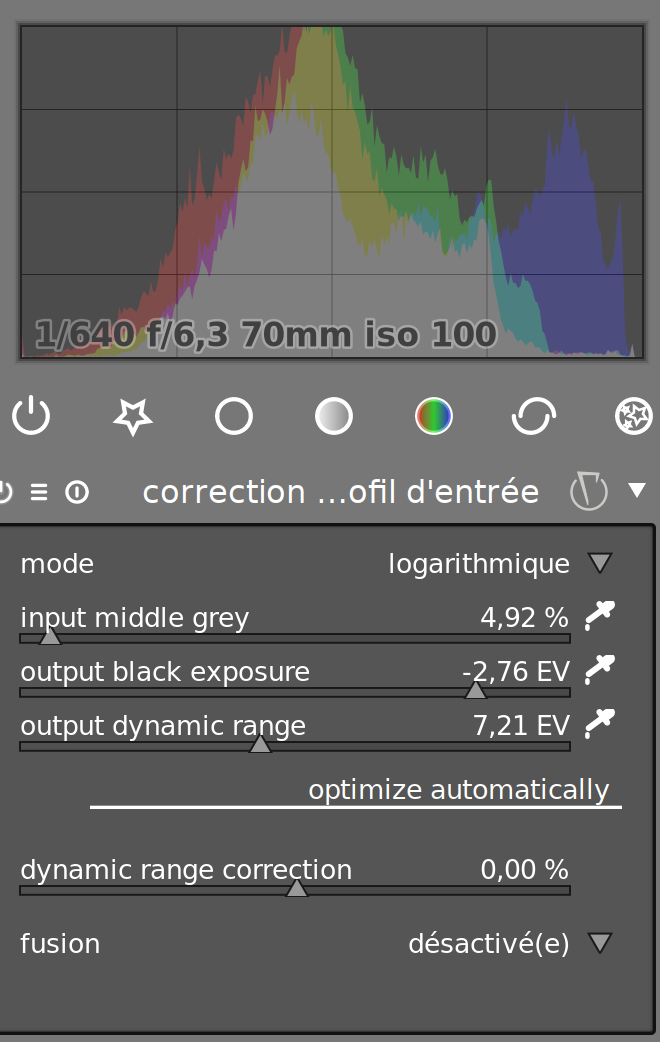

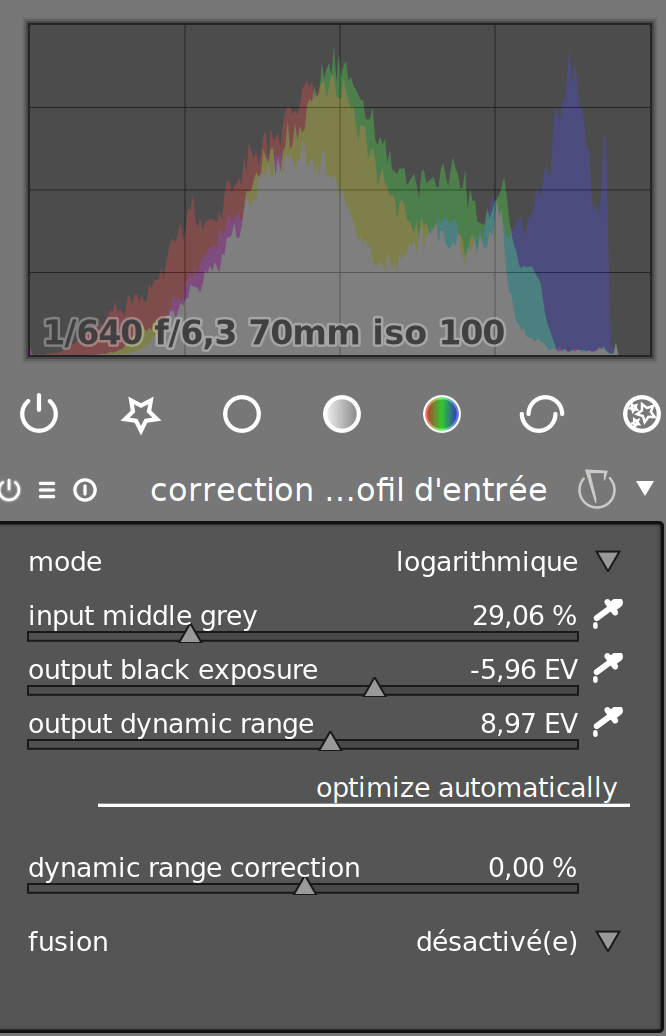
See the how the relative height of the blue peak in highlights evolves, compared to the grey/red peaks height in the middle ? The grey level sets how much you want to squeeze the histogram towards the center. Then, the dynamic range is the rescaling factor, and the black exposure is the offset.
is what happens when you use the color-picker in auto mode. Which is a fair guess, but not always a good one. That’s why you can manually hard-set the dynamic range and black exposure, making this equation a simple (log2(input / grey) - black) / dynamic_range
I see ![]()
These two are very intuitive and work as you say.
This one is not intuitive at all … And I’m able reproduce the histograms obtained with grey level 4%, 40% and 100%, keeping it at 18% just playing with the 2 remaining sliders.
This means that the grey slider is useless.
The posemeter should be able to provide dynamic range EV and black EV. But I don’t see how I could use the shot of grey target…
Don’t worry if you don’t want to remove the grey slider (and some bits which work with it), I’m still happy, the 2 others do very well the job. ![]() And thank you for your patience and given explanations.
And thank you for your patience and given explanations.
There is another topic which is of interest, the plugin used as a preset. It should have an automatic logarithmic mode (in the sense of the exposure plugin). No need to click on color picker. Could work with black point and white point corrections, depending of the type of shot … a wonder. ![]()
If you are able to reproduce the same histogram, no matter the grey level, it means that your picture is already well-balanced and probably doesn’t need this module. But in general, with HDR pictures, it is not the case.
You shoot the grey target, adjust the dynamic range to fit your posemeter measures, then use the color picker to get the average luma of the target, and duplicate this setting to all your pictures from the same lighting conditions.
That’s a tricky one because of the noise levels and such. I tried to do that, but the automatic detection is not 100 accurate (the minimum luma is not always the true black point), so having an auto mode that works 50 of the time is just an argument given to people to say opensource is crap.
Well, I value your feedback since it gives me a hint of how users will understand the module.
If you could share the image you have used to show the slippage I would try to remap the histograms as I did for my own picture.
EDIT. In fact that’s simple. I’m able to reproduce the same histogram with any value of grey just in changing the black point. I haven’t the non well balance image you talk about but I don’t see why the behaviour would be different.
Some maths to demonstrate it.
out = (log2(input / grey) - black) / dynamic_range
let’s say I change grey to grey1.
out1 = (log2(input / grey1) - black) / dynamic_range
If I try to get back the initial out with this grey1 just playing with black point:
out = (log2(input / grey1) - black1) / dynamic_range = (log2(input / grey) - black) / dynamic_range
(log2(input / grey1) - black1) = (log2(input / grey) - black)
log2(input) - log2(grey1) - black1 = log2(input) - log2(grey) - black
black1 = black + log(grey) - log2(grey1) = black + log2(grey/grey1)
This is valid for all inputs (well balanced or not, clipping aside)
I understand that grey value is introduced in the equation merely to transform the input into stops but doesn’t transform the shape of the log.
I’m afraid I cannot do better to convince you that 2 inputs are enough to define a portion of log curve (as for a portion of line) and the grey slider is useless.
This could be similar to the point I made above; the grey level is there to be able to keep consistant output values between frames/images (where you would choose a particular grey and stick with it). So even if your input domain changes you still get the same output value for a similar grey. Yes you can calculate it and add, but that’s the reason: you would have to calculate it.
1 Like
The consequence of choosing the grey point in the middle of the distribution as @Aurélien suggests is to ensure that dynamic range can be expressed as [-x,x] stops domain (centred).
But as the plugin works with any grey value, it can be constant, let’s say 18%…