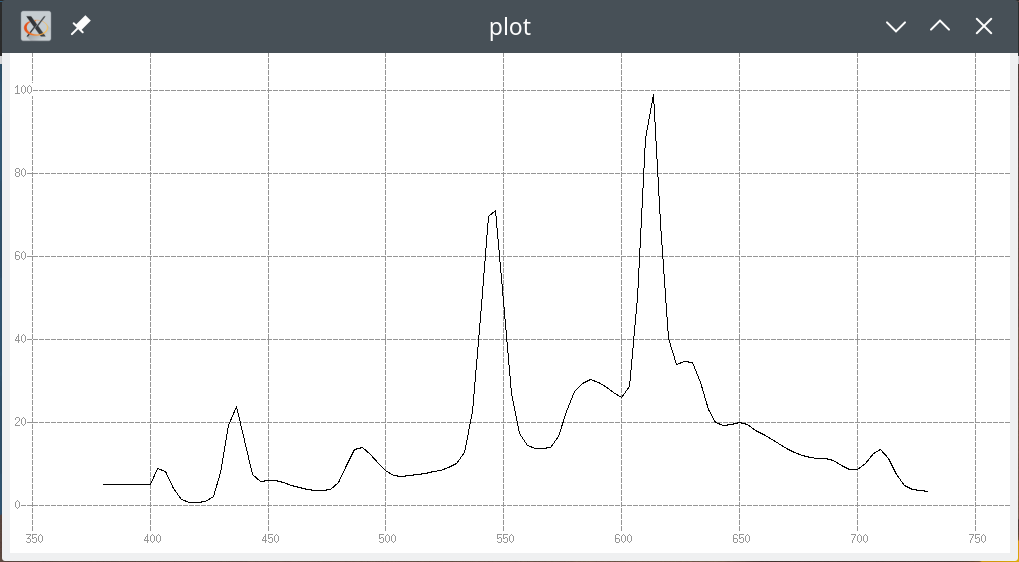
The last few days I have had problems with a “studio shot” (please read a desktop arrangement); a minute blue flower became far too red/violet when shot. I began to suspect the studio light (please read desktop lamp) and started to investigate what spectra our modern light bulbs/tubes really emit.
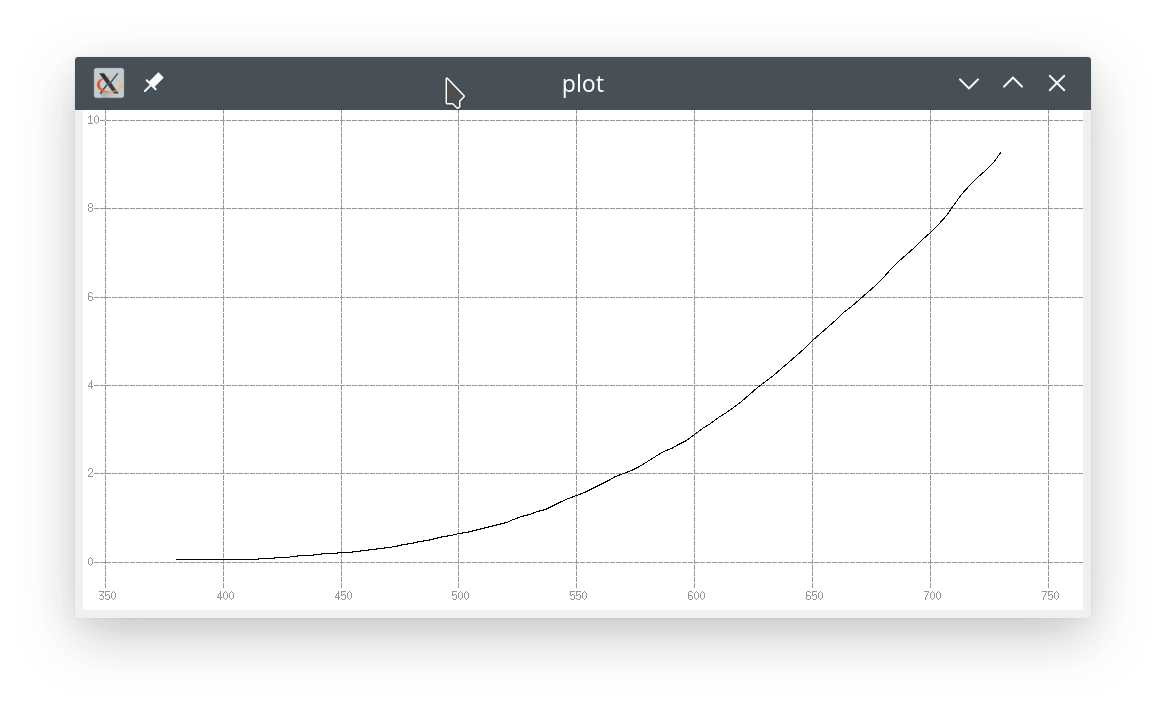
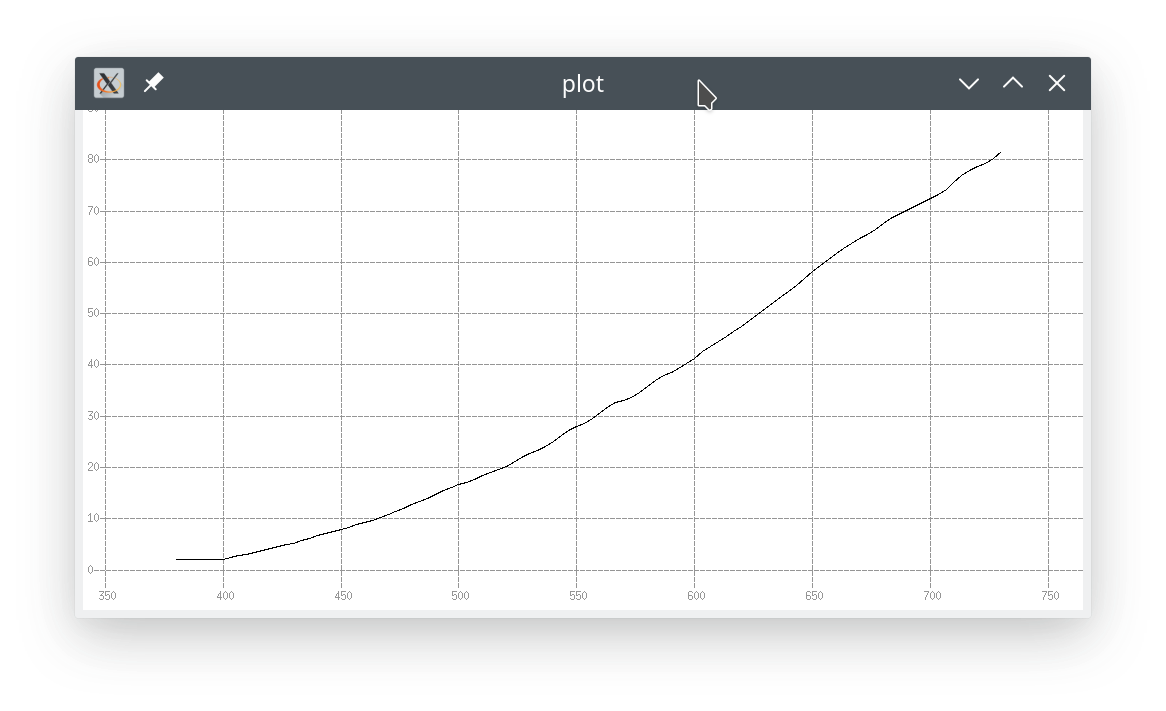
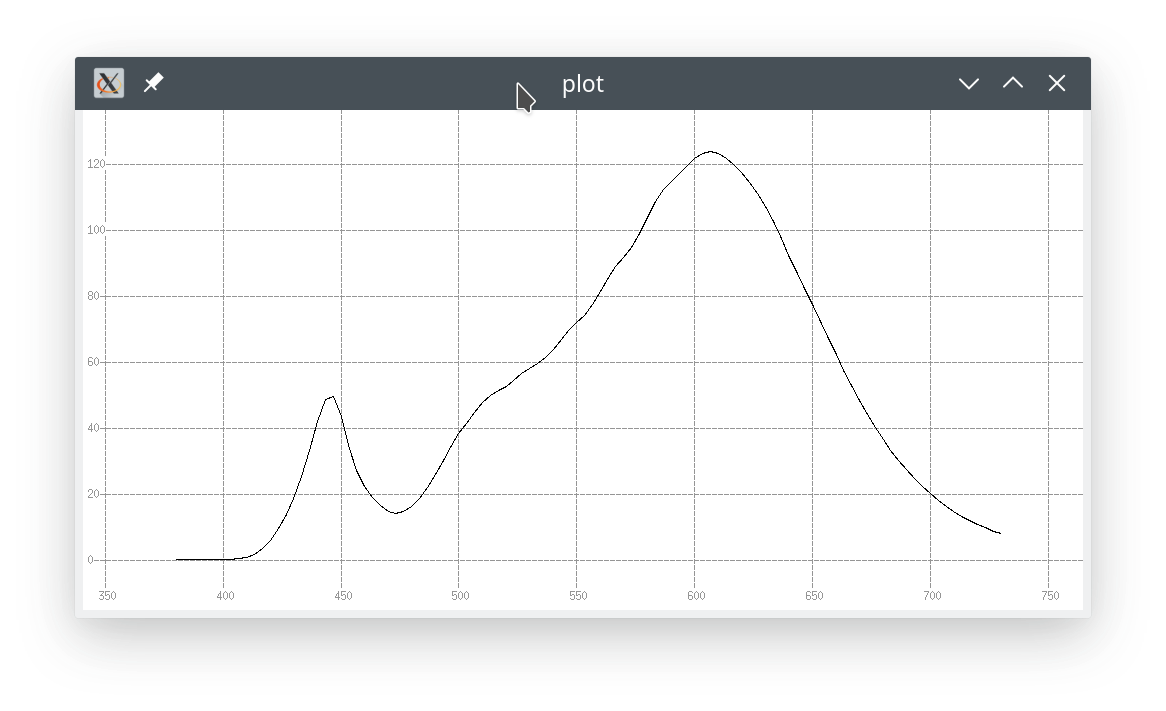
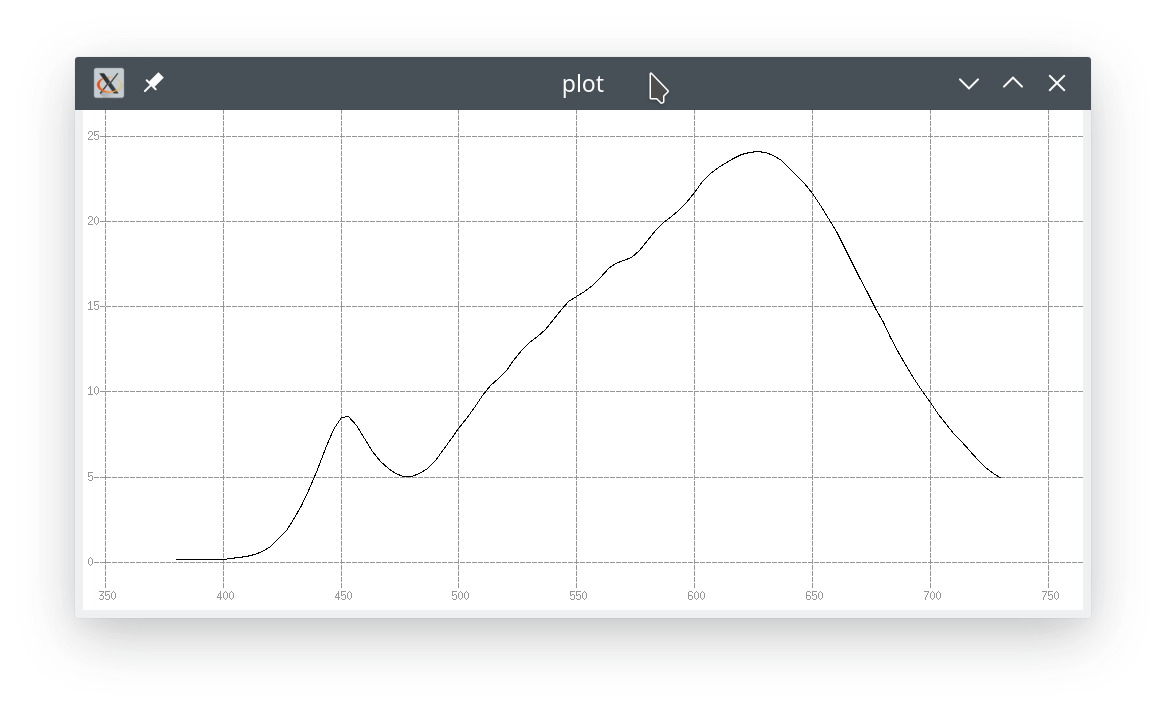
Using @gwgill’s illumread and a ColorMunki Photo, I produced graphs for every kind of light source that was available in our house. Please note that the y-axis differ, depending on the “wattage” of the light source. The x-axis shows wavelength.
The Natural Group
First, the spectrum that the Sun emits in Southern Sweden, at around noon:
The “wattage” of the next one is very easy: it is 1 cd. Here is the spectrum from a candle:
Incandescent bulb
A good old incandescent light bulb:
A halogen light bulb:
The LED group
A modern IKEA LED bulb:
An IKEA 1000lm LED, named Ryet:
A weaker IKEA LED bulb (which I used for the original blue flower shot):
For comparison, a cheap 24-LED panel:
A recent filament LED:
The Low Energy fluorescent tube group
A Grafilite studio low energy fluorescent tube:
A low energy fluorescent tube, specified at 6K5:
A low energy fluorescent tube, manufactured around 10 years ago:
Luckily, none of them turned out to have any spectral emission gaps.
Have fun!
Claes in Lund, Sweden

