I am preparing my first professional print and I’m a bit confused about how the histogram behaves when Softproof is enabled in darktable. I hope someone can clarify what exactly the histogram represents in this mode.
Does the histogram, when Softproof is active, show the gamut/dynamic range of the target medium (the paper) or is it still relative to the system display profile?
Why do I see “headroom” in the highlights when switching to Softproof? Does it mean the paper can represent brighter whites than my monitor, or is the histogram scaling differently because the paper-white is technically “darker” than monitor-white?
Specifically regarding the Histogram scale: If the histogram represents the 0-100% range after being processed through the Softproof profile, I would understand seeing more headroom in the highlights. However, shouldn’t there also be “air” on the left side (blacks), since the paper cannot print a “true” 0% black compared to the display? In my case, the blacks seem to clip/crush instead of showing headroom.
Is it correct to “push” the exposure until the Softproof-histogram touches the right edge, even if it causes clipping in the normal darkroom view?
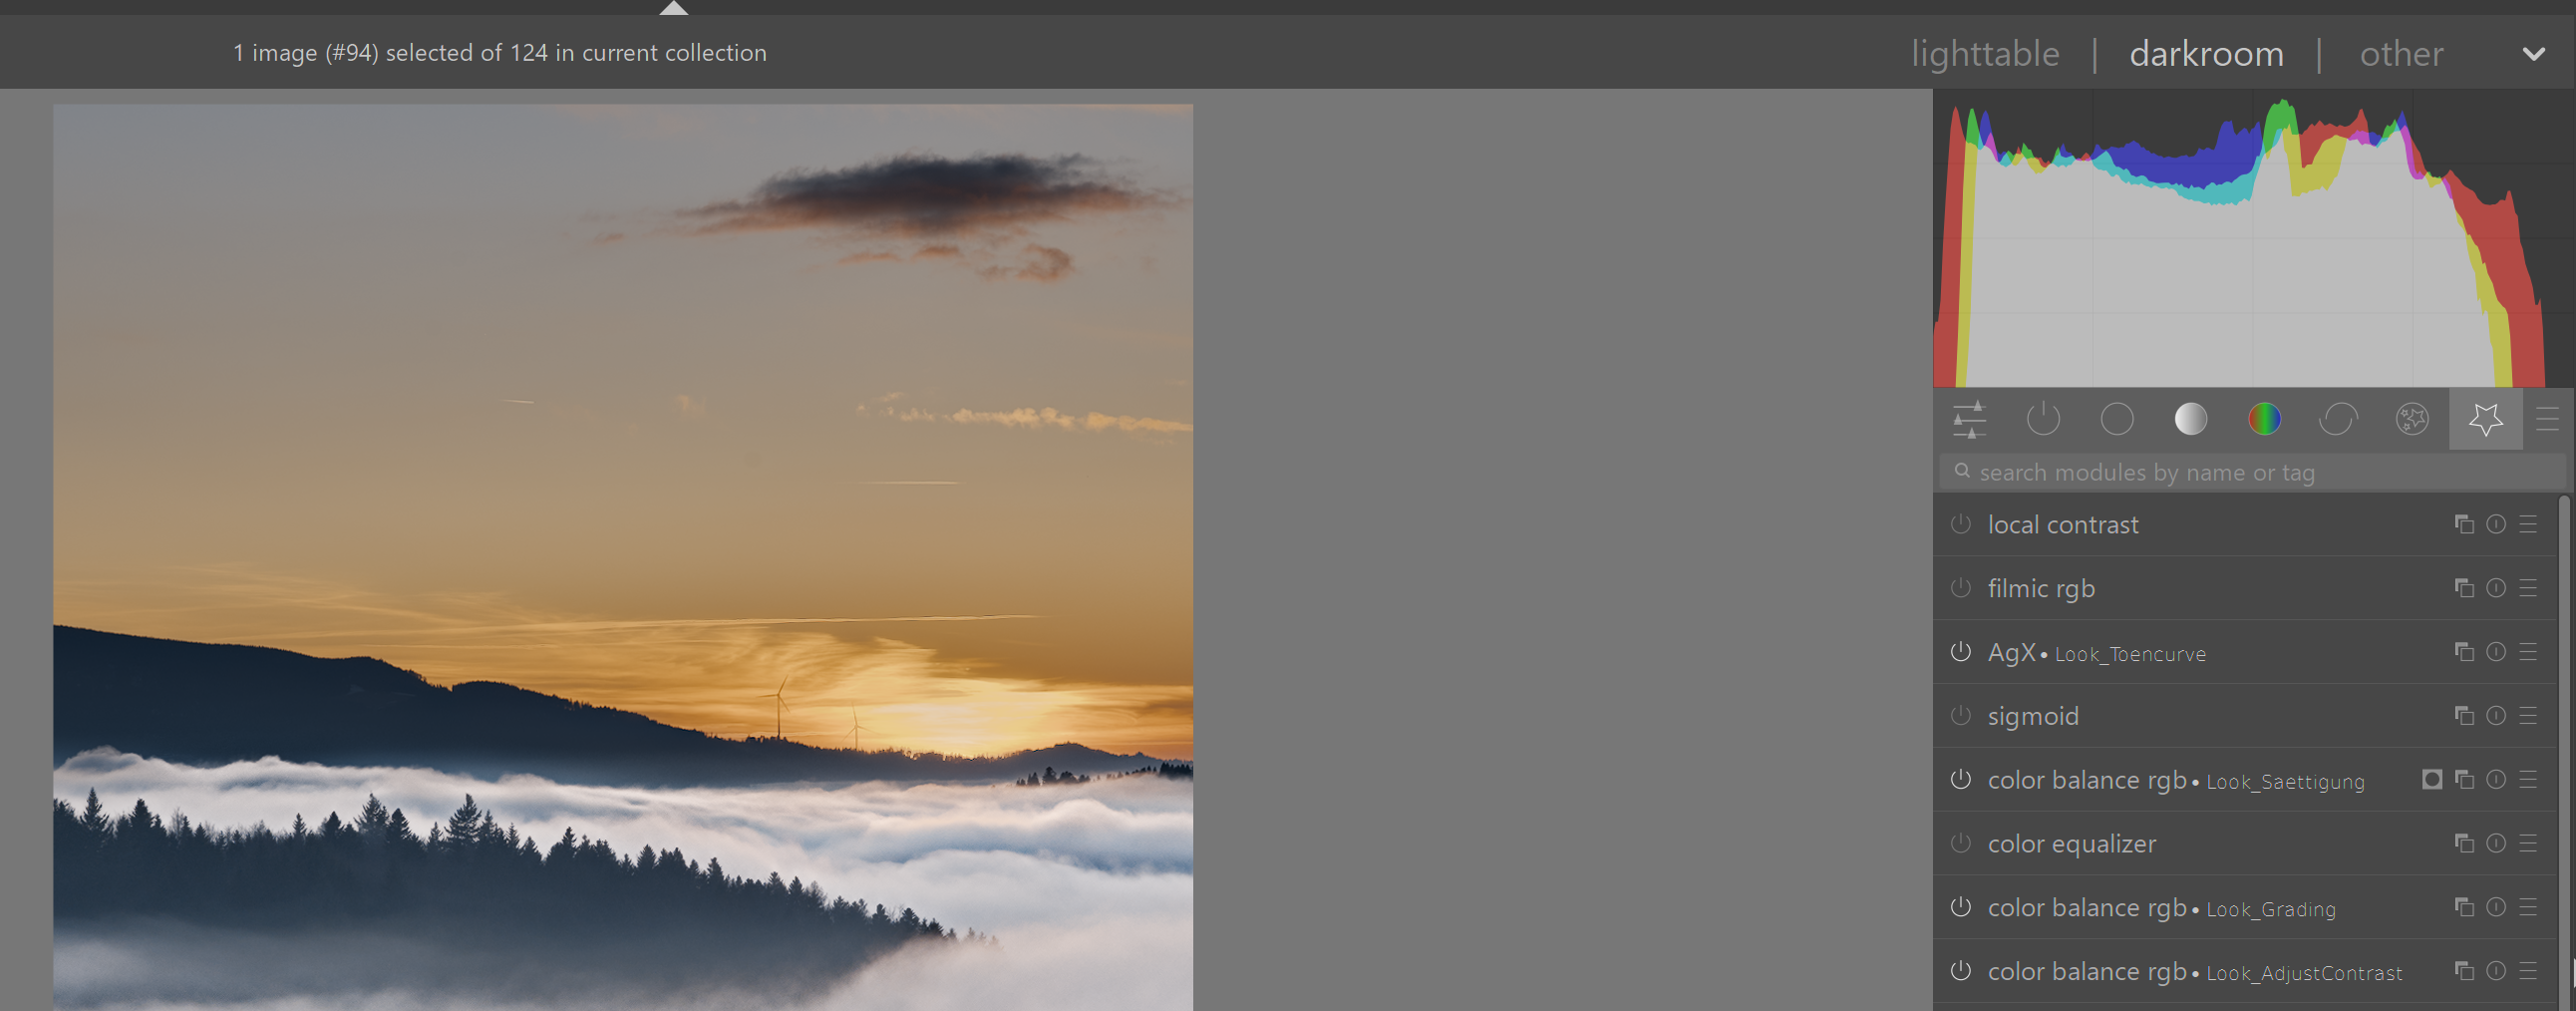
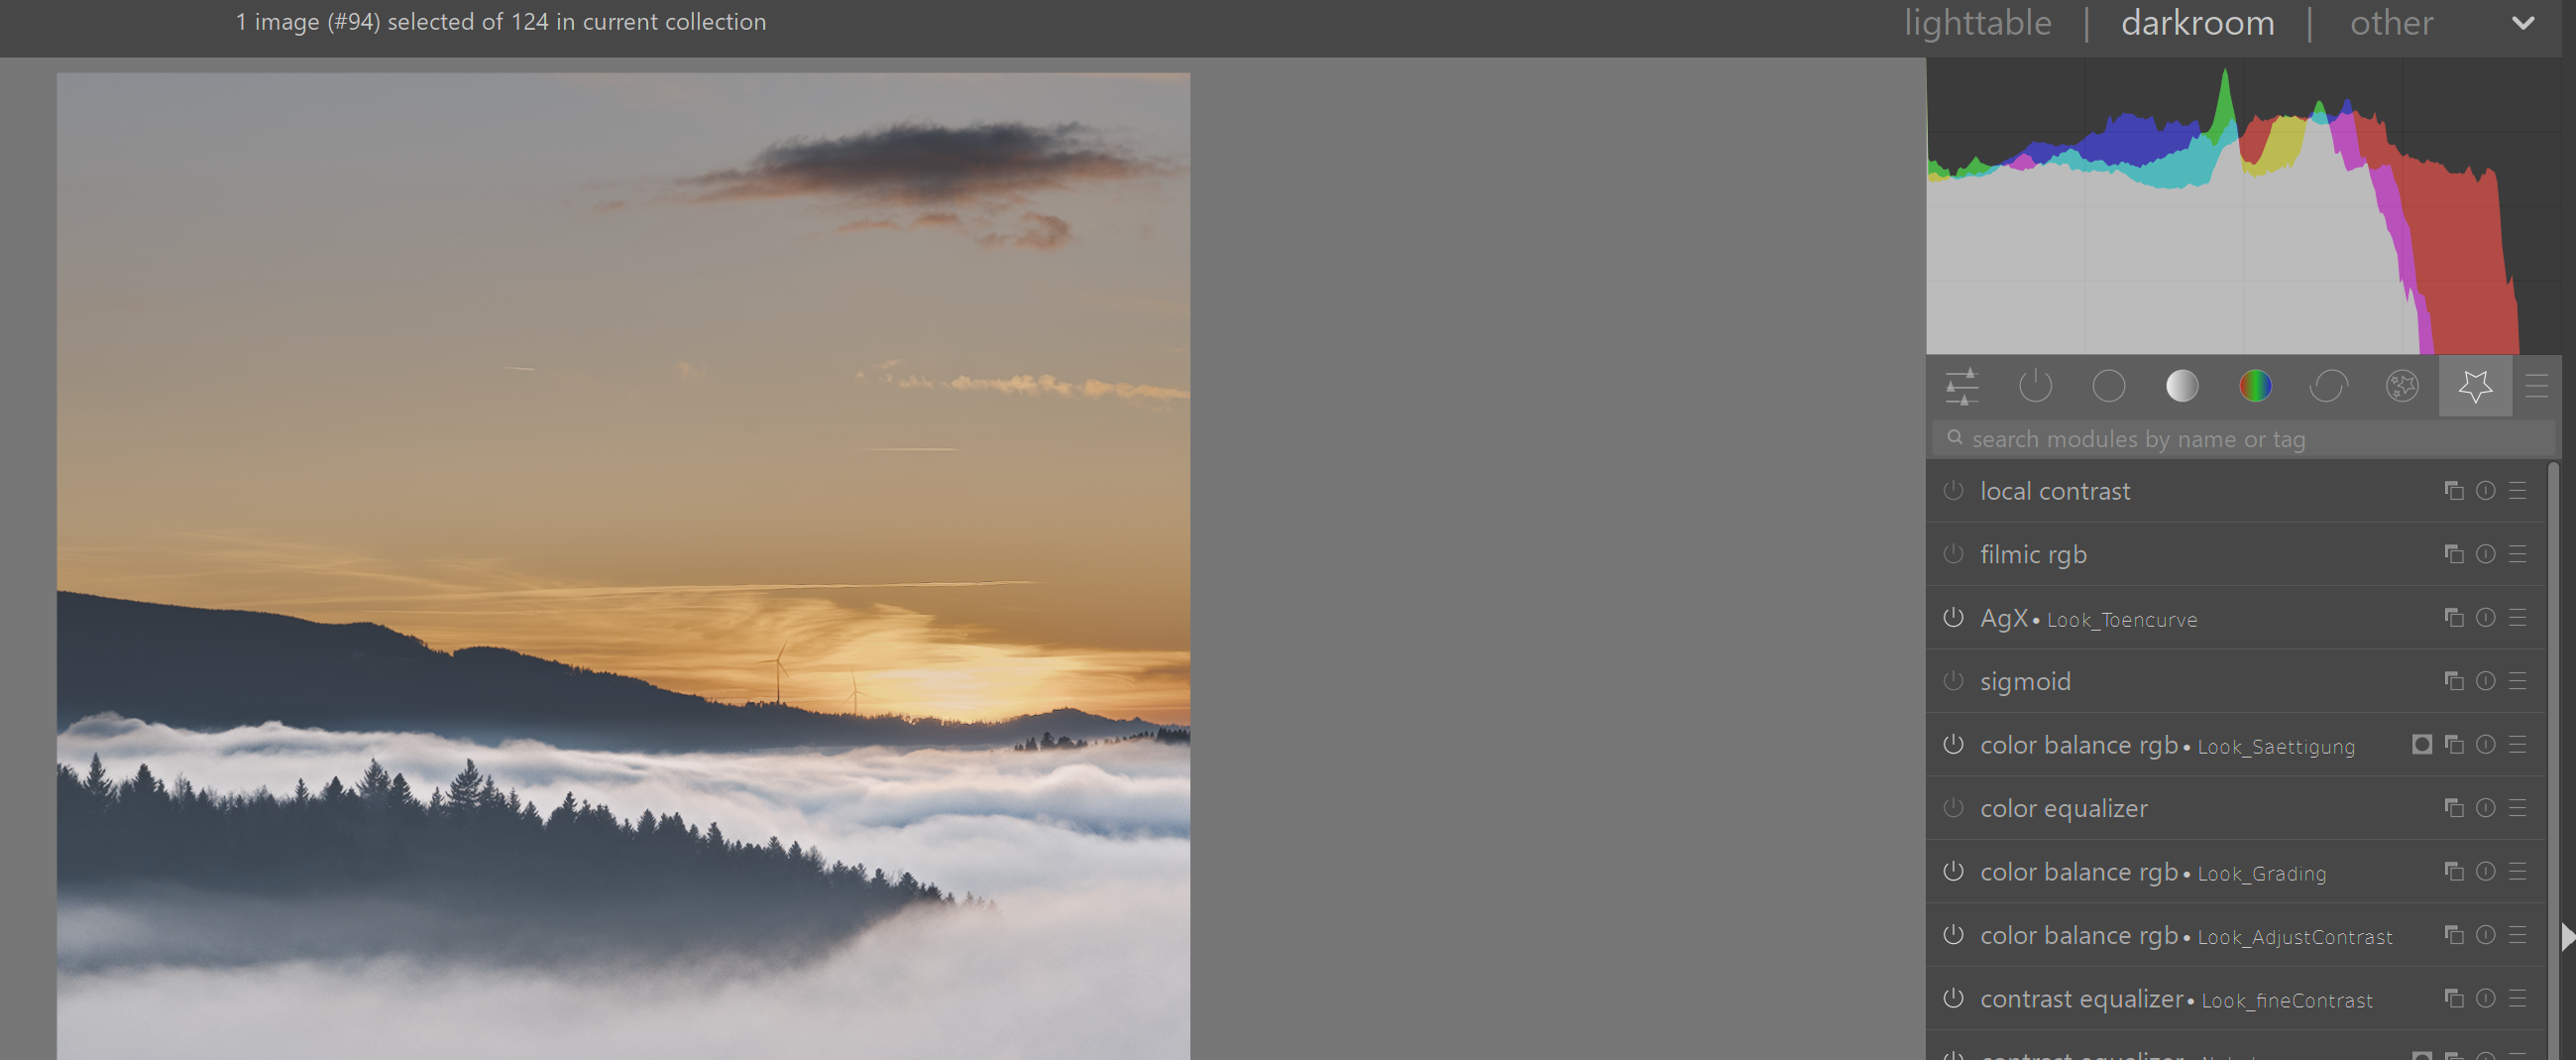
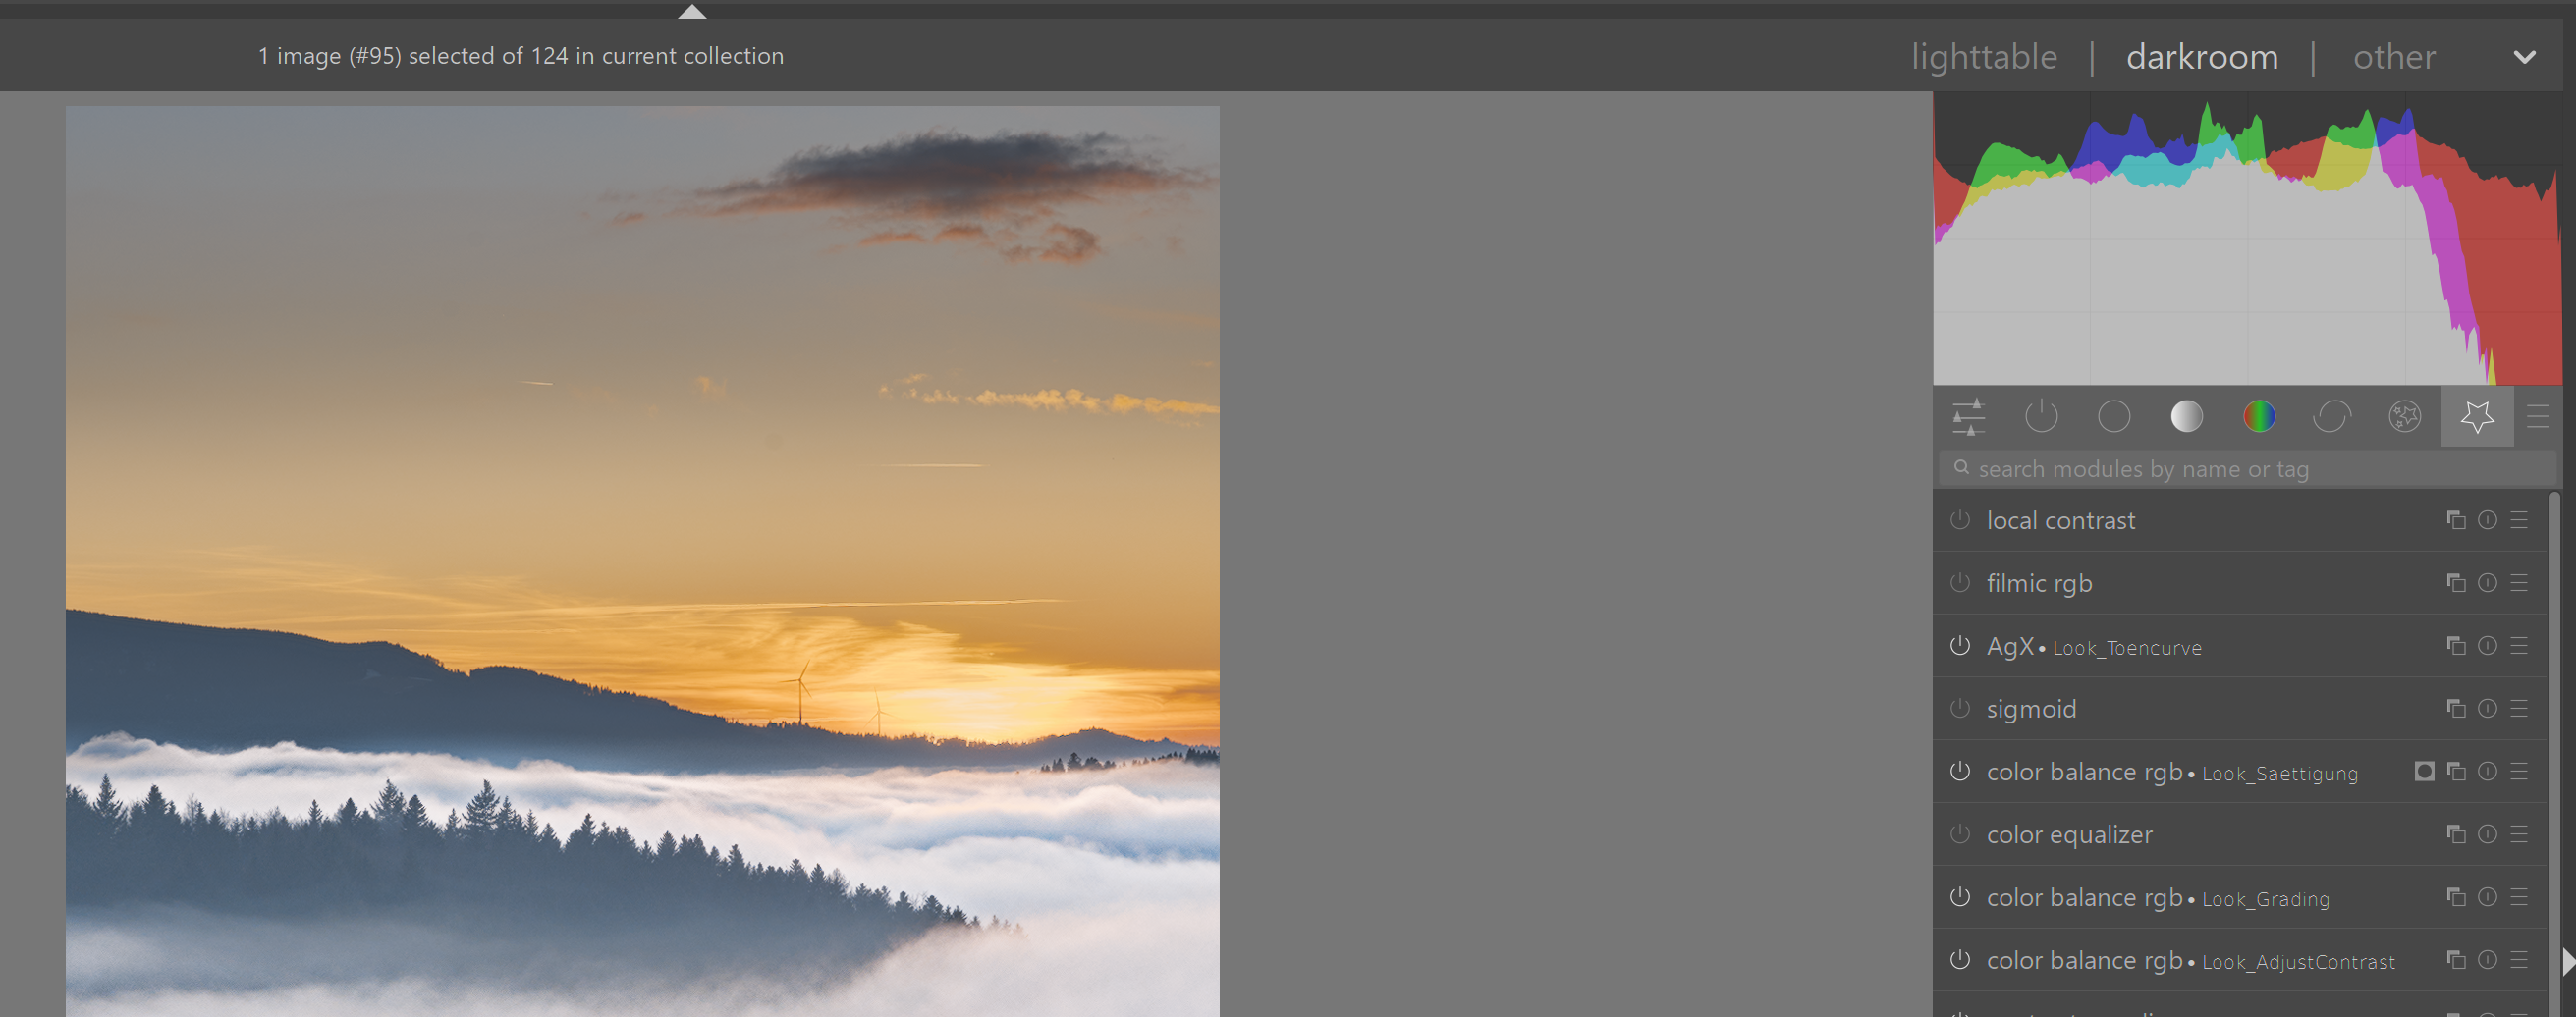
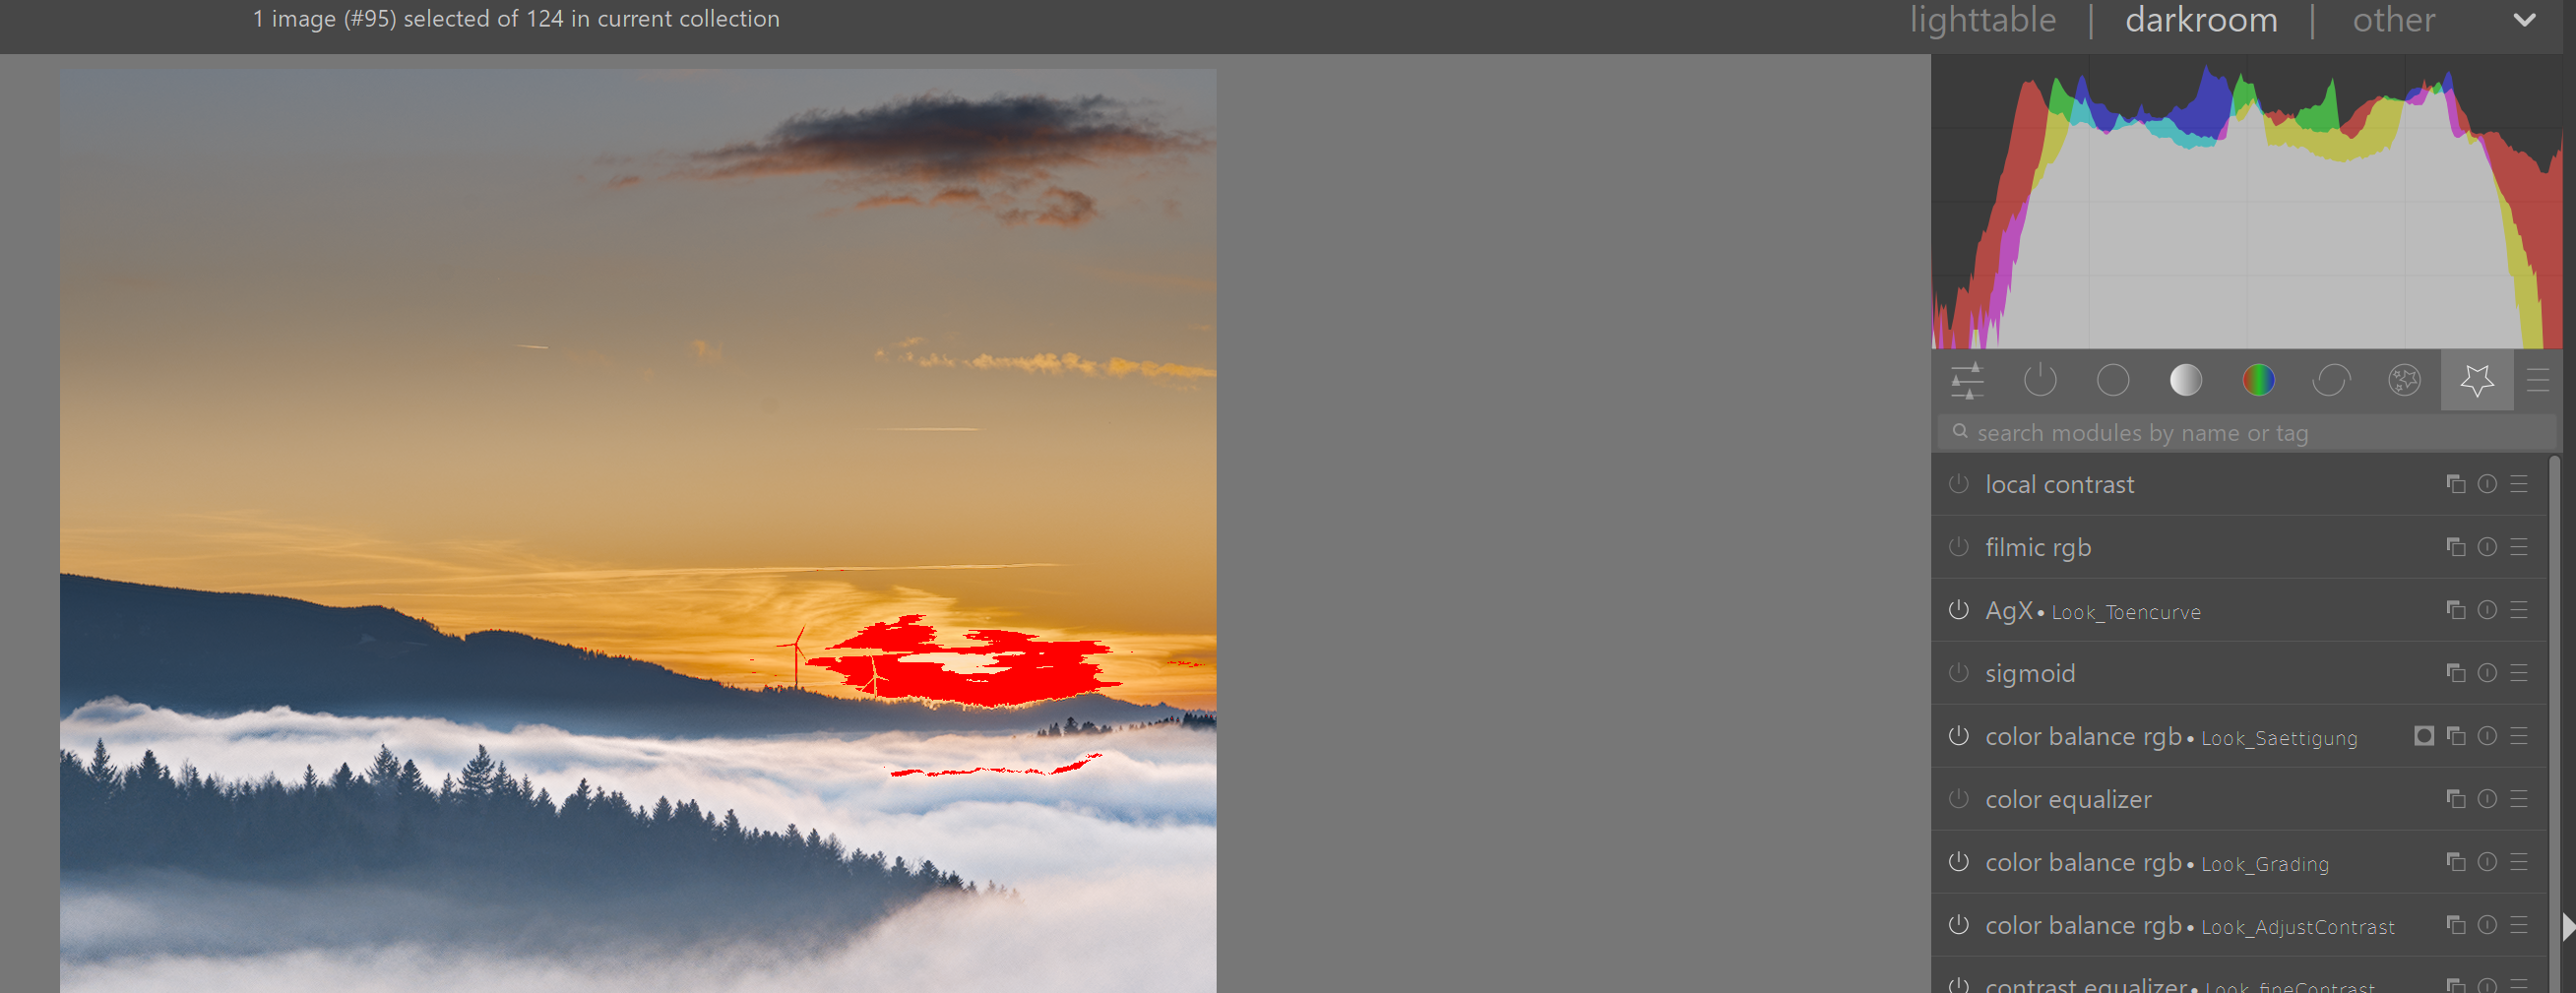
I’ve attached screenshots of the different states to illustrate the behavior. Any insights on how to correctly interpret the histogram in this context would be greatly appreciated!
There’s a complex interplay between the profiles, the histogram, gamut check / clipping indicator and soft proofing.
(Edit: when I rearranged the links to put the user guide first, I forgot to remove some text, and it seemed I was claiming authorship of the content in the manual.)
And regarding the clipping indicator, gamut check and profiles:
The main difference is the monitor is backlit and paper is reflective. There are many properties of paper that affect the final product including brightness and grain. You will need to add exposure for your highlights to look similar. Also the printing process being used CMYK or RGB will make a difference. The print profile is supposed to take this in consideration and some take media in to consideration.
Everything in the chain from your monitor calibration to the printing device and media will affect the outcome.
Since has been years since I’ve had anything to do with this stuff I will not comment in anything more than these generalities . You printer will be your good source of information.
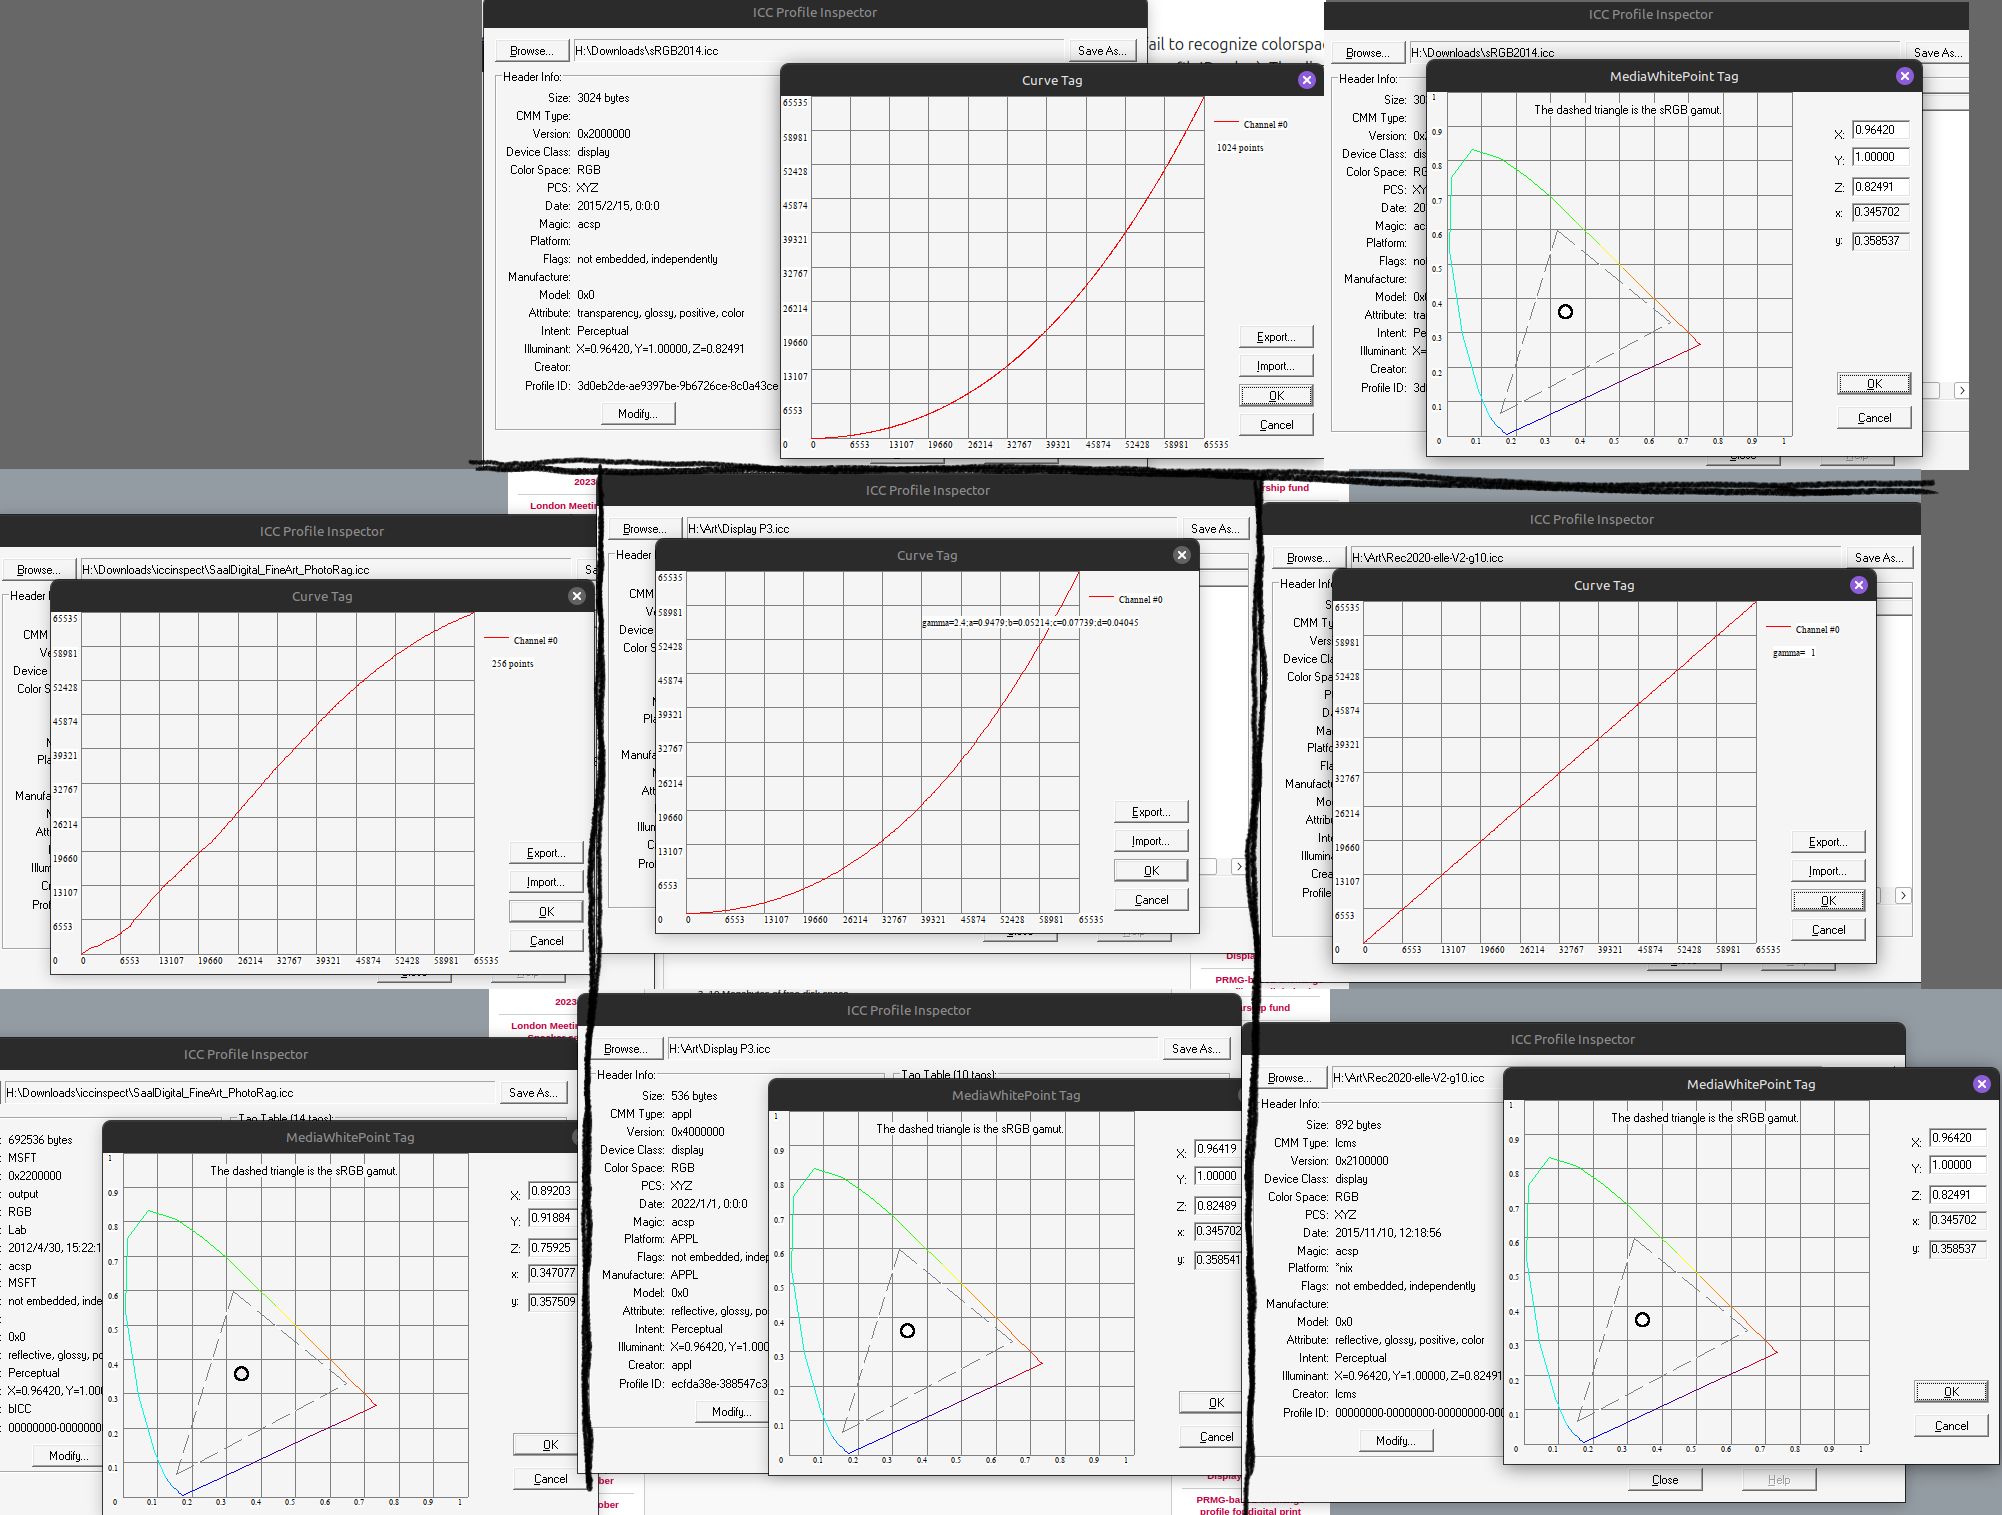
I’m not an expert but I’m relatively confident about colour management. I’ve downloaded the colour profile you linked, and I found ICC’s profile inspection tool. I’ve made a comparison of the transfer curves and white points of the printer, sRGB, Display P3 and linear Rec2020.
It looks like the paper’s white point is lower than screen profiles. The main thing IMO is that the printer’s transfer (gamma) curve is much closer to linear than to 2.2 gamma. This will be the main cause of the histogram ‘moving to the left’ when you activate soft proofing, so you shouldn’t change exposure based on that.
I think that soft proofing in Darktable is a way to see if colours are outside of the capabilities of the soft proof profile. If your clipping indication is set to ‘full gamut,’ and it shows clipping when soft proof is active, then that’s a good indication that the printer won’t be able to represent it properly.
A small piece of advice: Export in 16-bit.
To try to answer your questions:
I think the default histogram profile is the export (output colour) profile, and the default there is sRGB. Yes, in softproof mode, the histogram shows the image values mapped to the softproof profile instead.
EDIT: It shouldn’t be ‘relative’ to the system display profile, but the data is converted to the system display profile before being sent to the scopes module (and converted again). Hence the warning at the bottom of the scopes manual page.
The majority of this is the almost-linear transfer curve I mentioned earlier, compared to the standard sRGB transfer function.
I think 0% in the printer profile would only map to the darkest colour available to the printer, which may well be a higher luminosity than the current output profile’s darkest shade. Also, the different transfer curve will appear to squash darker values together.
I don’t think so, especially in this case. Darkroom view does colour management based on your display profile, so the image in darkroom view will look the same regardless of output colour profile (example: set output colour profile to linear rec2020, observe how the histogram changes but not the displayed image).
If nothing has been touched the default histogram profile is linear rec2020 not the output profile which has its own default and profile setting that as you have noted is sRGB by default…
An important factor regarding the (un)reliability if scopes, including the histogram, is:
As the scopes module runs at the end of the preview pixelpipe, it receives data in display color space. If you are using a display color space that is not “well behaved” (this is common for a device profile), then colors that are outside of the gamut of the display profile may be clipped or distorted.
A simple matrix profile, such as the built-in sRGB, will not clip values.
However, if you use a calibrated display profile that has LUTs, you data will be clipped, and no matter what histogram profile is used, you’ll see a histogram that’s the result of your image sent through your display, and then the displayed colours being mapped into the histogram space.
Oh, that makes it more clear to me. Pixelpipe → display colour profile for centre view and navigation preview, and that data is then sent to the scopes module. (Then the scope converts it back to the selected histogram profile, e.g. output or softproof profile)
So in that case of the LUT display profile, it’s important to avoid clipping before using the histogram to check other profiles’ values.
But what is ‘clipping’? How do you know at which point your display profile will introduce clipping? Clipping is not only about values > 1, but also values < 0 (in your display’s space, when it receives a saturated colour it cannot display). The pipeline runs in wide-gamut Rec 2020, then it goes to the display profile, and then to scope / histogram profile.
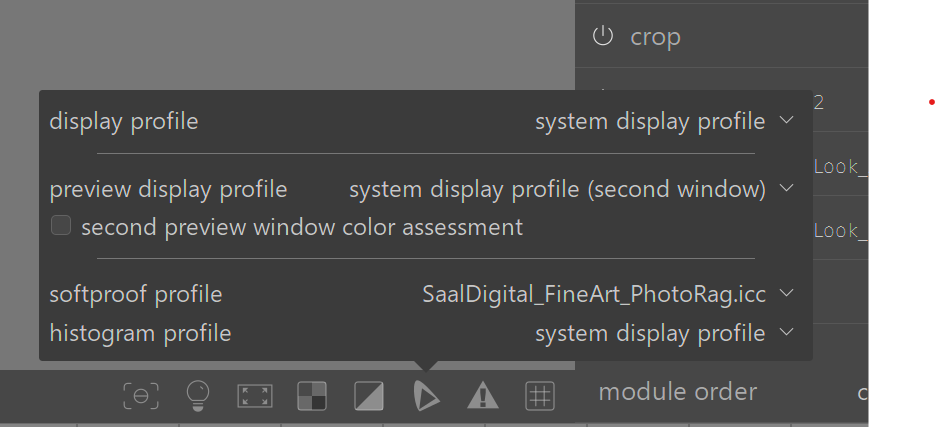
Monitor: BenQ SW271 (hardware calibrated to AdobeRGB).
Display Profile: Set to “system display profile”.
Histogram Profile: Set to “system display profile”.
I haven’t changed these defaults intentionally. Based on your input, should I ideally set the Histogram Profile to a fixed space like AdobeRGB or Rec2020 to be independent of the display?
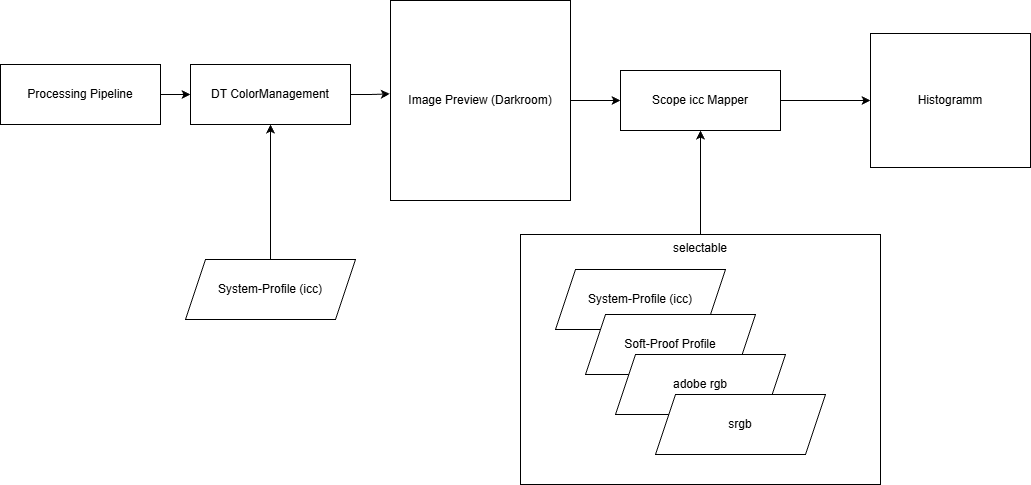
trying to understand the Signal Flow
Let’s leave the clipping indicator aside for a moment and focus on the Histogram.
If I understand @kofa correctly, the main “bottleneck” or complexity arises because the Scope module takes the Display-processed preview image as input, not the raw pipe output.
I tried to visualize this flow in two diagrams. Could you please verify if my understanding of the “mapping chain” is correct?
1. Normal Darkroom Mode (No Softproof)
Here, the preview and scope effectively use the same profile space.
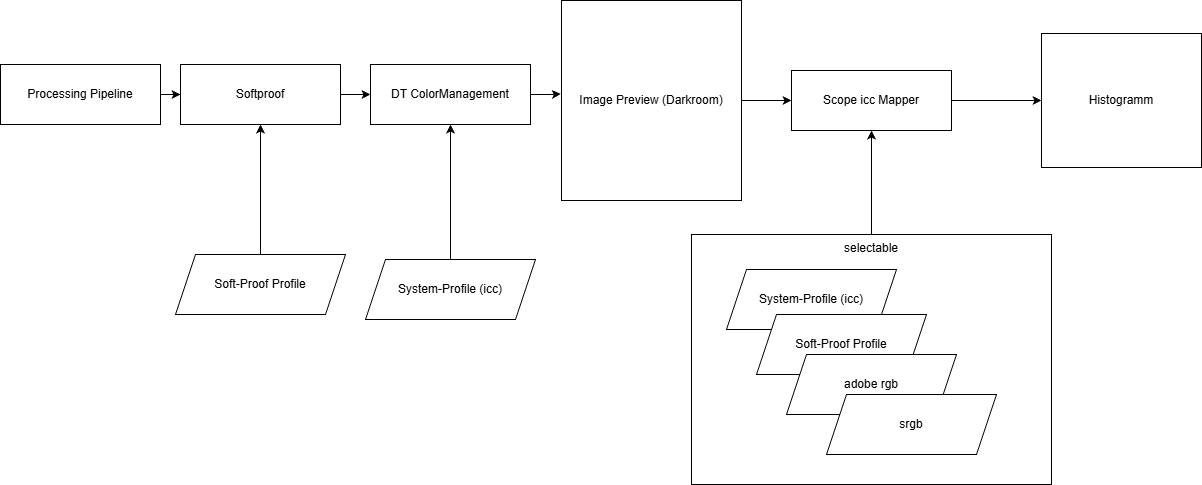
The pipeline converts to the Softproof Profile (Printer).
Then it converts to the Display Profile (Monitor) so I can see it.
Question: Does the Scope module then take this Monitor-ready data and convert it back to the Softproof profile (if selected in the histogram settings) to display the graph?
Regarding the Histogram X-Axis Scaling: My intuition tells me that the Histogram should scale its X-Axis (0-100%) to the full dynamic range of the currently selected “Histogram Profile”.
If the profile is linear (like the Hahnemühle one), I understand the data is distributed differently (squashed to the left).
But if the histogram represents the target medium, shouldn’t 0% be “Paper Black” and 100% “Paper White”? Or does 0-100% always represent absolute 0-255 (or 0-1.0 float) values, regardless of what the “Black Point” of the profile actually looks like physically?
Thanks for helping me debug my mental model of darktable!
Its quite simple set your display profile and histogram profile to linear rec2020 and then swap your display profile back in …if the histogram changes your display is introducing clipping for any profile with a wider gamut… Your image on the screen will change doing this of course as rec2020 is not the right display profile but it creates a data pass through that gives you a reference and then when you swap out your display profile you can watch for issues… you can do the same with DT’s srgb…its well behaved and won’t show “clipping” if I recall…
You can follow the logic from here
There are a good few discusssions around this, one midstream one from a thread is here you can go back and forth from here…it also migrates to some later ones.
I believe before leaving that AP tackled this in his fork of DT, Ansel and removed the histogram profile. The histogram going forward was a reflection of the profile selected for output and it no longer interacted with the display profile… I think more or less ART and RT work this way too.
Art has a nice toggle that allows you to display it in the working space or the output space…it seems very logical and clear to the user what they are looking at…
So, during export, we go from pipe space to output space, conversion taking place in the output color profile.
When in the darkroom, the output profile is overridden with the display profile.
The histogram takes this data, converts it to the histogram profile.
If soft proofing is enabled, LCMS (the colour management library) still converts to the display profile, but but with soft-proofing turned on. As I understand, this means LCMS will apply the soft-proofing profile, and then convert that to the display profile (trying to show how e.g. a printed image would look, converting the printed colours to your monitor’s space). Then, as previously, this is sent to the histogram, but the histogram profile is set to the soft-proofing profile (unless it is a CMYK profile, in which case Rec 2020 is used).
Interesting. Back in 4.2- 4.4 edit: 4.0(that seems like ages ago)… this was not the case. The histogram could be separate from the soft-proof (as in a change in histogram profile would change the histogram even with softproof turned on).
I have been on automatic pilot wrt changing settings when I use softproof, which is admittedly not often anymore, without actually paying attention if it was needed. Thanks for the heads up!!
Thanks everyone for taking the time to explain it.
Especially @gwbarn@kofa@priort
I still don’t fully understand it but you helped to point me in the right direction to research it more by myself.
(Knowing what i don’t know is valuable to)
for me “flow graphs” valuable to wrap my head around concepts like this.
Yes, I just had another look at your first screenshots.
Edit: I tested out softproofing with this profile, and the whole displayed image’s contrast is just reduced, probably to emulate the profile’s dynamic range? Also, lots of dark areas still had detail in the darkroom view, but the global colour picker was showing RGB 0,0,0 regardless, before raising AgX’ target black. I’m probably just too confused at this point.
You can see the spike on the very left of the histogram in screenshot 2. (The highlights haven’t changed between screenshots)
Edit: Actually, the dark values still change significantly when turning softproof off after doing that large exposure gain, so I’m missing something again… Still, might be worth addressing the spike of crushed values on the histogram in softproof mode…
edited out thought
If you’re happy with the highlights, you could use AgX’ target black point, or lift sliders, to ease this crushing, but it will obviously change the dynamic range compression a bit further up.
Yes, this is a complicated topic. I started a few weeks ago to edit images for printing and I have somehow the same questions.
Anyway, when it becomes clear, this might be a very good topic/chapter in DT documentation …
Aurelin has written some posts for Ansel on his website. Ansel for those that don’t know is a fork of DT. He has taken down all his DT materials I believe and I think also maybe basically moved on from the project … but he has some good write-ups for some topics including wb and printing etc that because of shared DNA might be of interest to some …
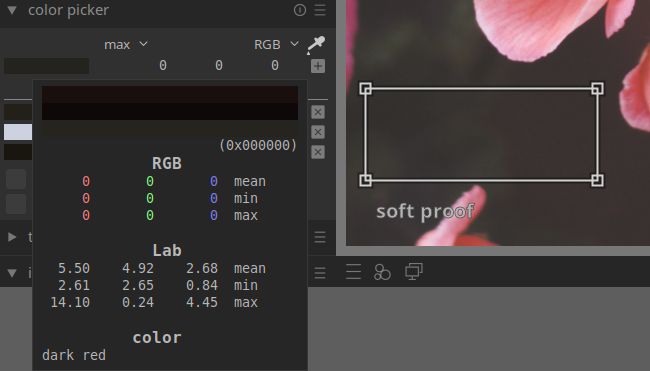
Okay, it seems Darktable is having a problem converting from the display profile (both built in sRGB or Display P3) to the printer profile in the histogram and thus the global colour picker. Picker’s Lab values are correct! See image below.
I think the darkroom main image display is accurate, with a contrast reduction to simulate the print dynamic range.
So I think your histogram from the first post is partially moved to the left because of the different transfer curve, and it is also representing data incorrectly. I exported a jpeg with the printer colour profile, and after colour management, it looks almost exactly the same as a jpeg exported with a normal display profile, except with a tiny rise in the darkest areas.
You won’t need to edit anything in your picture, not even the target black level, in my opinion.
For me lab values don’t change. They dont change with softproof activation or a histogram profile change even though in each case the histogram changes and…using a 24 patch color chart with the picker set to rgb mode the picker values do change and the changes seem to be reflecting and honoring activation to the softproofing profile or a change in the histogram profile… I also checked my display profile is not clipping and changing it to linear rec2020 alters the display ie it becomes dark as you might expect but there is also no impact on the picker values so no interference from the display profile in the pipeline for these observations…
So for me I think they are working fine for rgb but lab is does not seem to get processed in the same way…